Skip to content

Posts from the ‘Software Business Models’ Category

Best- And Worst-Performing Cloud Computing Stocks Through Q3, 2013

cloud-computing-stock-update-October-2013-300x225
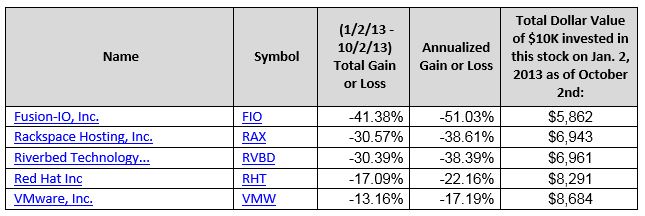
The five highest-performing cloud computing stocks as of Q3, 2013 in the Cloud Computing Stock Index have proven prowess in closing enterprise-level deals, expertise in compliance and security, and years of infrastructure experience.
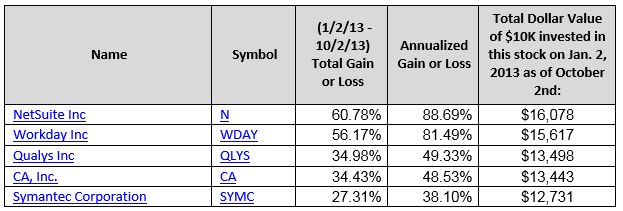
Twelve of the nineteen companies in the index delivered a positive return in the first three quarters of this year.  NetSuite (NYSE:N) leads all companies in the index with an annualized gain as of calendar Q3 of 88.69% and has a dollar value of $16,078 on $10,000 invested on January 2nd of this year.    Workday (NYSE:WDAY) attained an annualized gain of 81.49% as of Q3, and has a dollar value of $15,617 on $10,000 invested on January 2nd.  Qualys (NASDAQ: QLYS) attained an annualized gain of 49.33% and delivered $13,498 on $10,000 invested from January 2nd to October 2nd of this year.  The following table lists the top best performing cloud computing stocks in the index.

Best Performing 

high-performing-cloud-computing-stocks

Worst Performing

Seven of the nineteen companies in the index lost value, with Fusion-IO (NYSE:FIO) experiencing the greatest annualized loss in stock value of -51.03% and $10,000 invested on January 2nd of this year being worth $5,862 as of October 2nd.  Rackspace (NYSE:RAX) had an annualized loss of -38.61%, with $10,000 invested on January 2nd being worth $6,943 as of October 2nd.  The following table shows the five lowest-performing cloud computing stocks in the index.

low-performing-cloud-computing-stocks

The nineteen companies that comprise the Cloud Computing Stock Index attained a 19.41% return from October 3, 2012 to October 2, 2013.  In the same period Microsoft gained 13.98%, Oracle, 7.05% and SAP, 4.83%. Please click on the index to expand it for easier viewing.

CLOUD-INDEX-FOR-A-YEAR

Specifics on the Cloud Computing Stock Index

I used The Cloud Times 100 as the basis of the index, selecting nineteen companies all of which are publically traded.  The latest edition of the Cloud Computing Stock Index is shown here.  The filter applied to these companies is that 50% or more of their revenues are generated from cloud-based applications, infrastructure and services.  Please click on the index for easier viewing.

clous-computing-stock-index-October-2-20132-1024x351

Note: I do not hold equity positions or work for any of the companies mentioned in this blog post or included in the Cloud Computing Stock Index.  

Using Search Analytics To See Into Gartner’s $232B Big Data Forecast

By combining search analytics and the latest Gartner forecast on big data published last week, it’s possible to get a glimpse into this areas’ highest growth industry sectors.  Big data is consistently a leading search term on Gartner.com, which is the basis of the twelve months of data used for the analysis.

In addition, data from Gartner’s latest report, Big Data Drives Rapid Changes in Infrastructure and $232 Billion in IT Spending Through 2016 by Mark A. Beyer, John-David Lovelock, Dan Sommer, and Merv Adrian is also used.  These authors have done a great job of explaining how big data is rapidly emerging as a market force, not just a single market unto itself.  This distinction pervades their analysis and the following table showing Total IT Spending Driven by Big Data reflects the composite market approach.  Use cases from enterprise software spending, storage management, IT services, social media and search forecasts are the basis of the Enterprise Software Spending for Specified Sub-Markets Forecast.  Social Media Analytics are the basis of the Social Media Revenue Worldwide forecast.

Additional Take-Aways

  • Enterprise software spending for specified sub-markets will attain a 16.65% compound annual growth rate (CAGR) in revenue from 2011 to 2016.
  • Attaining a 96.77% CAGR from 2011 through 2016, Social Media Revenue Is one of the primary use case catalysts of this latest forecast.
  • Big Data IT Services Spending will attain a 10.20% CAGR from 2011 to 2016.
  • $29B will be spent on big data throughout 2012 by IT departments.  Of this figure, $5.5B will be for software sales and the balance for IT services.
  • Gartner is projecting a 45% per year average growth rate for social media, social network analysis and content analysis from 2011 to 2016.
  • Gartner projects a 20 times ratio of IT Services to Software in the short term, dropping as this market matures and more expertise is available.
  • By 2020, big data functionality will be part of the baseline of enterprise software, with enterprise vendors enhancing the value of their applications with it.
  • Organizations are already replacing early implementations of big data solutions – and Gartner is projecting this will continue through 2020.
  • By 2016 spending on Application Infrastructure and Middleware becomes one of the most dominant for big data in Enterprise Software-Specified Sub Markets.

  • $232B is projected to be sold in total across all categories in the forecast from 2011 to 2016. From $24.4B in 2011 to $43.7B in 2016, this presents a 12.42% CAGR in total market growth.

Search Analytics and Big Data

Big data is continually one of the top terms search on Gartner.com, and over the last twelve months, this trend has accelerated.  The following time series graph shows the weekly number of inquiries Gartner clients have made, with the red line being the logarithmic trend.

Banking (25%), Services (15%) and Manufacturing (15%) are the three most active industries in making inquiries about big data to Gartner over the last twelve months.  The majority of these are large organizations (63%) located in North America (59%) and Europe (19%).

What unifies all of these industries from a big data standpoint is how critical the stability of their customer relationships are to their business models.  Banks have become famous for bad service and according to the American Customer Satisfaction Index (ACSI) have shown anemic growth in customer satisfaction in the latest period measured, 2010 to 2011.  The potential for using big data to becoming more attuned to customer expectations and deliver more effective customer experiences in this and all services industries shows great upside.

Bottom line: Companies struggling with flat or dropping rankings on the ACSI need to consider big data strategies based on structured and unstructured customer data.  In adopting this strategy the potential exists to drastically improve customer satisfaction, loyalty, and ultimately profits.

SaaS-based Analytics and Business Intelligence Market Update, August 2011

Challenging, uncertain economic times accelerate sales cycles and lead to more closed deals for business intelligence software providers.  Companies get an urgency to reduce costs and risks, relying on the insights gained from these applications.

There’s an interesting dichotomy starting to emerge in how experts and analysts define just how these markets will mature however.  Both agree that economic uncertainty are growth catalysts yet they diverge on adoption rates, roadblocks, and which analytics and BI technology will dominate in the years ahead.

This week I read Balancing Custom And Packaged Apps In Your Application Portfolio Strategy by George Lawrie, Mike Gilpin and Adam Knoll from Forrester and the latest Hype Cycle of Business Intelligence, 2011 by a collection of Gartner authors led by Andreas Bitterer.  I’ve summarized the key points of each below.

Forrester Sees SaaS Applications Overtaking Custom Application Development

Forrester sees SaaS-based applications starting to replace in-house custom application development, gathering momentum through 2013.  Gartner, with their Hype Cycle for Business Intelligence, 2011 just released this week, shows BI platforms having greater near-term benefit than SaaS-based analytics and BI.  Custom application development projects are going to face continued pressure to keep up with business requirements that SaaS applications are proving able to handle more effectively and economically than ever before.

In-house development makes more sense for specific analytics and reporting requirements,  yet will continually be eroded by SaaS-based applications that can meet most requirements at a lower cost.  Forrester has in the past said SaaS-based adoption of analytics applications in general and predictive applications specifically would be very slow due to data integration challenges.  This study points to a potential shift in their mindset, as the data shows SaaS-based analytics beginning to replace custom in-house developed applications.

Here are the key take-aways from the report:

  • Analytics processes are supported 79% of the time with custom application development.  Procure-to-pay (33%) and record-to-report (33%) are the second-most supported.  Multiple responses were allowed in the survey.
  • When asked which process areas they are automating with SaaS, analytics (33%), record-to-report (18%), order-to-cash  (15%), and purchase-to-pay (12%) were the most common responses.  There was a small sample size on the Forrester report and the most startling insight was how quickly respondent companies plan to migrate from custom application development to SaaS-based analytics and BI.
  • Nearly 50% of the respondents to the Forrester survey have between five and 19 SaaS-based applications today with 18% expecting to have 35 or more by 2013.  In addition 63% of respondents expect to deploy between five and 34 SaaS-based applications by 2013, a significant shift in just two years.
  • 36% of survey respondents say their  SaaS applications run completely standalone.  Another 36% mention they use a combination of on-premises Master Data Management (MDM) and process integration tools.  Ironically only 3% are deploying their applications on cloud-based MDM or process integration-based platforms.

Gartner’s Hype Cycle for Business Intelligence, 2011

Unlike the hype cycle for cloud computing, this hype cycle has fewer technology categories (25), a narrative firmly grounded in business process and strategy, and more practical and pragmatic insights versus just theoretical.  At 50 pages it’s  quick read and while there are many excellent points made, I have summarized the key take-aways pertaining to the highest hype points and SaaS adoption below:

  • Mobile Business Intelligence (BI) is the latest entry to the Hype Cycle for Business Intelligence based on the massive hype around analyzing locational and application data.  The hype surrounding the Apple iPad Series, Google Android and other tablet and smartphone platforms has made this one of the most hyped areas of the last year according to the analysis.
  • Consumerization, Decision Support, analysis of non-traditional data and “Big Data” are the areas of the greatest innovation today.  The hype cycle points to search, mobile, visualization and data discovery being the catalyst of Consumerization.  Predictive analytics, which is on the Slope of Enlightenment on this latest hype cycle, is critical to decision support.  The non-traditional and “Big Data” area of innovation is further supported by content, text analytics, in-memory DBMSs and columnar DBMSs.
  • SaaS-based Business Intelligence is at the apex of the Peak of Inflated Expectations yet will continue to have low adoption rates.  Gartner believes that the  lack of trust in third parties managing confidential data, and the inertia and fear many companies have in moving to a new architecture are slowing adoption.  This is in contrast to the survey Forrester released this week showing analytics being one of the most popular SaaS-based applications planned by 2013 in their base of respondents.
  • Gartner sees SaaS-based Business Intelligence of the most value to midsize and smaller organizations who lack IT staff yet have very specific, targeted information needs.  Website analytics, social media monitoring, dashboards, predictive analytics and Excel as a BI front-end all apply.  Both Forrester and Gartner agree on this point and see this type of custom development going away quickly internally.
  • There is a massive amount of hype surrounding in-memory computing, particularly from SAP at its Sapphire conferences .  Gartner believes that SAP’s vision of in-memory computing exceeds  in-memory analytics to include analytical and transactional processing.  As a result, In-Memory Database Management Systems are at the Peak of Inflated Expectations.


Source: Hype Cycle for Business Intelligence, 2011, Published 12 August 2011 | ID:G00216086 By Andreas Bitterer.  Gartner, Inc.

What Both Agree On

Forrester’s survey shows SaaS eventually replacing custom application development while Gartner’s Hype Cycle for Business Intelligence shows the practical, pragmatic technologies including dashboards, predictive analytics combined with the more complex Business Activity Monitoring (BAM), Business Intelligence Platforms, and Data-Mining Workbenches delivering the most value.  Despite these differences, both agree on the following:

  • The overall market for BI, Analytics and Performance Management continues to grow at between 8 to 12% per year depending on the forecast used.  The following forecast is from the report  Market Trends: Business Intelligence, Worldwide, 2011-2014, 7 June 2011 | ID:G00213483 by Dan Sommer and James Richardson.
Source: Market Trends: Business Intelligence, Worldwide, 2011-2014, 7 June 2011 | ID:G00213483 by Dan Sommer and James Richardson
  • 2011 continues to see large, strategic deals for analytics and BI closing more rapidly than they have in the past.
  • SaaS-based analytics and BI continues to gain a greater share of spending in midsize and smaller companies.  Both also agree that the proliferation of smaller SaaS-based analytics and Bi vendors concentrating on a specific niche have successfully displaced in-house custom development of competitive applications.  Trust in the smaller vendor, their track record, customer references and financial viability are what are winning deals for SaaS-based analytics and BI software providers today.
  • The market transition from build to buy is now in full force as budgets become available again.  This is key assumption of both analyses and means that smaller, more niche-oriented SaaS-based analytics and BI vendors stand a chance to get new reference accounts and grow, despite a challenging economy.

Analyzing SaaS Revenue Forecasts and Market Growth by Segment

[tweetmeme source=@LouisColumbus only_single=false]

A recent report published by Standard & Poor’s Equity Research Services on the computer software industry makes for interesting reading.

Zaineb Bokhari, Application Software Analyst authored the 47-page report.  He has shown how the software industry is going through a fundamental restructuring due to the impact of SaaS, open source, and the many variations in licensing programs.

His analysis also shows how these factors taken together form a powerful catalyst of long-term disruption to business models.  At one point, the study predicts the end of perpetual licensing due to the time-to-value contributions of SaaS-based applications.  The report is available for download to Equity Research Services clients, including many college and university online libraries that have Standard & Poor’s subscriptions.

Here are the key take-aways from reading this report:

  • IDC expects the market for global packaged software to grow at a compound annual growth rate (CAGR) of 5.8% from 2009 to 2014. Over the same period, IDC projects software-as-a-service will grow at a 25.3% CAGR.

  • Standard & Poor’s reports that the SaaS category is still dwarfed by traditional packaged software, which IDC sized at $272 billion in 2009 (versus $13.1 billion for SaaS).
  • According to IDC’s forecasts, the size of the SaaS will rise from just under 5% of the size of the packaged software market in 2009 to more than 11% by 2014.
  • Standard & Poor’s expects corporate spending on enterprise software and related maintenance to grow in the low to mid-single-digit range (i.e., 3%–6%) in 2010, with some segments expanding at above-average levels.
  • Overall revenues from SaaS delivery models reached $13.1 billion in 2009, a growth rate of 34.2% from 2008 according to IDC. IDC expects this revenue to rise to $40.5 billion by 2014, a compound annual growth rate (CAGR) of 25.3%. This is dwarfed by the $272 billion that IDC believes was spent globally on software in 2009.
  • Application development and deployment is projected to have the most rapid growth of all segments, attaining a 39.2% CAGR from 2009 – 2014. Please see the table below, Worldwide Software-as-a-Service Revenues Forecast by Segment for a year-by-year breakout of this category.
  • Infrastructure software is forecasted to grow at a 27.4% CAGR through 2014, totaling 11,345 instances by 2014 according to IDC.  The year-by-year breakouts are also included in the following table.
  • Applications are expected to have 20.4% CAGR through 2014 based in units and attain a 50.8% market share of all SaaS segments by 2014.

Bottom line: Enterprise software pricing models must change to stay in step with customers’ expectations of more value for their maintenance and licensing fees. The evolving economics of cloud and SaaS-based application deployment are in the process of permanently re-ordering enterprise software.

Flickr attribution: http://www.flickr.com/photos/8011986@N02/2964298027/in/photostream/#/

Oracle’s 2010 Roadmap to Enterprise Cloud Computing

[tweetmeme source=@LouisColumbus only_single=false]

At the 7th Annual Cloud Expo held earlier this month at the Santa Clara Convention Center, Rex Wang of Oracle presented his company’s 2010 roadmap to Cloud Computing.  Rex is the VP of Product Marketing with responsibility for cloud and grid computing, in addition to enterprise architecture, modernization and embedded systems.

Key take-aways from this presentation include the following:

  • 28.6% of respondents have internal or private clouds today according to an IOUG Study cited in the presentation.
  • 54.% of respondents do not use public cloud providers.
  • 24.7% use Application Server Platform as a Service, the highest percentage across PaaS and IaaS adoption from the study completed.
  • Financial & accounting (19.6%), HR (18.6%) and collaboration-based apps including e-mail (18.2%) are the three most common applications running on private cloud services

Oracle’s 2010 roadmap to Cloud Computing provides insights into how they are shaping their private cloud value proposition and selling strategy around Exadata, Exalogic, and WebLogic.  Oracle clearly sees private clouds dominating.

Bottom line: The future of cloud architectures will be much more hybrid in structure and scope, as every enterprise has legacy data that cannot be easily moved into private clouds.  Add in the complexity of aggregating and normalizing unstructured content, and the direction of cloud architectures will be more hybrid, less private, over time.

Ingram Micro Seeing Traction with Cloud Conduit Initiative

Bottom line: Reselling cloud computing services shows much potential as a market for technology platform and application providers. The challenge is the ability to tailor the services mix efficiently and accurately enough to capitalize on scalability and selective demand of mid-tier and small business end users.

Read more

Assessing the Cloud Computing Landscape: Insights from the MIT Enterprise Forum

Bottom line: The following video provides a topical, informative and useful update on the cloud computing landscape; it’s worth the 30 minutes to listen to and consider how rapid the development platforms are maturing.

Read more

eBook Explains and Analyzes the Seven Business Models of Software

Bottom line: Most refreshing about this book is that Mr. Chou is striving to explain each of the seven business models with an unbiased analysis supported with company examples. He is on Twitter (@timothychou) and back in January asked for feedback on this book. If you have a passion for this area you might want to follow him on Twitter and see about helping out with the next edition.

Read more