Skip to content

Posts from the ‘Cloud computing enterprise adoption’ Category

Gartner Predicts Public Cloud Services Market Will Reach $397.4B by 2022

Gartner Predicts Public Cloud Services Market Will Reach $397.4B by 2022
  • Worldwide end-user spending on public cloud services is forecast to grow 23.1% in 2021 to total $332.3 billion, up from $270 billion in 2020.
  • Garter predicts worldwide end-user spending on public cloud services will jump from $242.6B in 2019 to $692.1B in 2025, attaining a 16.1% Compound Annual Growth Rate (CAGR).
  • Spending on SaaS cloud services is predicted to reach $122.6B this year, growing to $145.3B next year, attaining 19.3% growth between 2021 and 2022.  

These and many other insights are from Gartner Forecasts Worldwide Public Cloud End-User Spending to Grow 23% in 2021.  The pandemic created the immediate need for virtual workforces and cloud resources to support them at scale, accelerating public cloud adoption in 2020 with momentum continuing this year. Containerization, virtualization, and edge computing have quickly become more mainstream and are driving additional cloud spending. Gartner notes that CIOs face continued pressures to scale infrastructure that supports moving complex workloads to the cloud and the demands of a hybrid workforce.

Key insights from Gartner’s latest forecast of public cloud end-user spending include the following:

  • 36% of all public cloud services revenue is from SaaS applications and services this year, projected to reach $122.6B with CRM being the dominant application category. Customer Experience and Relationship Management (CRM) is the largest SaaS segment, growing from $44.7B in 2019 to $99.7B in 2025, attaining a 12.14% CAGR. SaaS-based Enterprise Resource Planning (ERP) systems are the second most popular type of SaaS application, generating $15.7B in revenue in 2019. Gartner predicts SaaS-based ERP sales will reach $35.8B in 2025, attaining a CAGR of 12.42%.
  • Desktop as a Service (DaaS) is predicted to grow 67% in 2021, followed by Infrastructure-as-a-Service (IaaS) with a 38.5% jump in revenue. Platform-as-a-Service (PaaS) is the third-fastest growing area of public cloud services, projected to see a 28.3% jump in revenue this year. SaaS, the largest segment of public cloud spending at 36.9% this year, is forecast to grow 19.3% this year. The following graphic compares the growth rates of public cloud services between 2020 and 2021.  
  • In 2021, SaaS end-user spending will grow by $19.8B, creating a $122.6B market this year. IaaS end-user spending will increase by $22.7B, the largest revenue gain by a cloud service in 2021. PaaS will follow, with end-user spending increasing $13.1B this year. CIOs and the IT teams they lead are investing in public cloud infrastructure to better scale operations and support virtual teams. CIOs from financial services and manufacturing firms I’ve recently spoken with are accelerating cloud spending for three reasons. First, create a more virtual organization that can scale; second, extend the legacy systems’ data value by integrating their databases with new SaaS apps; and third, an urgent need to improve cloud cybersecurity.

Conclusion

CIOs and the organizations they serve are prioritizing cloud infrastructure investment to better support virtual workforces, supply chains, partners, and service partners. The CIOs I’ve spoken with also focus on getting the most value out of legacy systems by integrating them with cloud infrastructure and apps. As a result, cloud infrastructure investment starting with IaaS is projected to see end-user spending increase from $82B this year to $223B in 2025, growing 38.5% this year alone. End-user spending on Database Management Systems is projected to lead all categories of PaaS through 2025, increasing from $31.2B this year to $84.8B in 2025. The following graphic compares cloud services forecasts and growth rates:

10 Charts That Will Change Your Perspective Of Microsoft Azure’s Growth

  • Microsoft Azure revenue grew 50% year-over-year in fiscal Q2, 2021, contributing to a 26% increase in Server products and cloud services revenue.
  • According to the latest earnings call, more than 1,000 Microsoft customers now use Azure Arc to simplify hybrid management and run Azure services across on-premises, multi-cloud and at the edge.
  • Commercial cloud gross margins increased to 71% in the latest quarter, up from 67% a year earlier.
  • There are now over 60 Azure regions globally, strengthening Microsoft’s competitive global position versus Amazon Web Services.
  • Microsoft reported $43.08 billion in the second fiscal quarter ended Dec. 31, up from $36.91 billion a year earlier,

These and many other insights are from Microsoft’s Fiscal Year 2021 Second Quarter Earnings Conference Call and related research. Microsoft’s early decision to double down on expanding their cloud platform by accelerating new product and services development and Azure region expansion is paying off. Azure’s revenue growth shows Microsoft is an innovation machine when it comes to the cloud.  

In their latest fiscal quarter, Microsoft announced hundreds of new services and updates to Microsoft Azure alone. The most noteworthy are improvements to Microsoft Cloud for Healthcare, Azure Defender for SQL, Password spray detection in Azure AD Identity Protection, Azure Stack HCI, Azure Stack Edge, Azure Data Factory now being available in five new regions and many more. All Azure updates are available in an online index that provides options for finding those now available, in preview, or in development.  

The following ten charts will change your perspective of Microsoft Azure’s growth:

  • Intelligent Cloud delivered the highest operating income of all segments in the 2nd quarter at $6.4 billion or 36% of total consolidated operating income. This quarter, Microsoft’s success with indirect channel sales combined with more enterprise customers accelerating their cloud-first initiatives contributed to Intelligent Cloud leading all segments in operating income. The following is from the Q2, FY21 Earnings Call.
10 Charts That Will Change Your Perspective Of Microsoft Azure's Growth
  • Synergy Research Group’s latest cloud market analysis finds that Amazon and Microsoft are over 50% of the global cloud provider market, with Microsoft reaching 20% worldwide market share for the first time. Q4, 2020 enterprise spending on cloud infrastructure services was just over $37 billion, $4 billion higher than the previous quarter and up 35% from the fourth quarter of 2019. Synergy Research notes that it has taken just nine quarters for the market to double in size.
10 Charts That Will Change Your Perspective Of Microsoft Azure's Growth
  • 63% of enterprises are currently running apps on Microsoft Azure, second only to AWS.  Azure is narrowing the gap with AWS in both the percentage of enterprises using it and the number of virtual machines (VMs) enterprises are running on it. 6% of enterprises are spending at least $1.2 million annually on Microsoft Azure. Source: Statista and Flexera 2020 State of the Cloud Report, page 50.
10 Charts That Will Change Your Perspective Of Microsoft Azure's Growth
  • 2020 total cloud infrastructure services spending grew 33% to $142 billion from $107 billion in 2019, according to Canalys, with Microsoft’s indirect channel business fueling their 20% market share growth. Microsoft’s dominance of indirect selling channels is evident in the level of sales enablement, sales and technical support they provide resellers. Canalys’ Chief Analyst Alastair Edwards says that “organizations are turning to trusted business partners to advise, implement, support and manage their cloud journeys and articulate the real business value of cloud migration.”
10 Charts That Will Change Your Perspective Of Microsoft Azure's Growth
  • 19% of enterprises expect to invest significantly more on Microsoft Azure in 2021, leading all other cloud vendors this year. Microsoft Azure leads all vendors when compared to the percentage change in spending this year. It’s noteworthy that 61% of all enterprises interviewed expect to increase their investments in Microsoft Azure this year, second only to Microsoft SaaS software. Source: 2021 Flexera State of Tech Report, January 2021.
10 Charts That Will Change Your Perspective Of Microsoft Azure's Growth
  • Microsoft Azure Stack is the second most-used private cloud platform by enterprises, with 35% of them currently running apps today. Azure Stack also leads all others in experimentation, with one in five enterprises, or 21%, currently in that phase of deployment. 67% of all enterprises interviewed in the 2020 Flexera State of the Cloud Report are either running Azure apps or are considering it.
10 Charts That Will Change Your Perspective Of Microsoft Azure's Growth
  • Microsoft’s centerpiece for their intelligence investment is the Microsoft Intelligent Security Graph, which processes over 630 billion authentications across our cloud services each month. Microsoft relies on the Security Graph to gain insights into normal behavior, including sign-ins and authentications and abnormal behavior, including attempted bypasses to two-factor authentication. Microsoft blocks more than 5 billion distinct malware threats per month, providing a great deal of useful data to analyze endpoints across customers’ networks. Source: Microsoft CISO Workshop 1 – Cybersecurity Briefing.
10 Charts That Will Change Your Perspective Of Microsoft Azure's Growth
  • 44.5% of enterprises say Microsoft Azure is their preferred provider for Cloud Business Intelligence (BI). Azure is considered 27% more critical to an enterprises’ Cloud BI requirements and preferences than Amazon Web Services. It’s noteworthy that 96.5% of all enterprises have a preference for Microsoft Azure BI versus its main competitors, including Google Cloud, IBM BlueMix, or Alibaba.   
10 Charts That Will Change Your Perspective Of Microsoft Azure's Growth
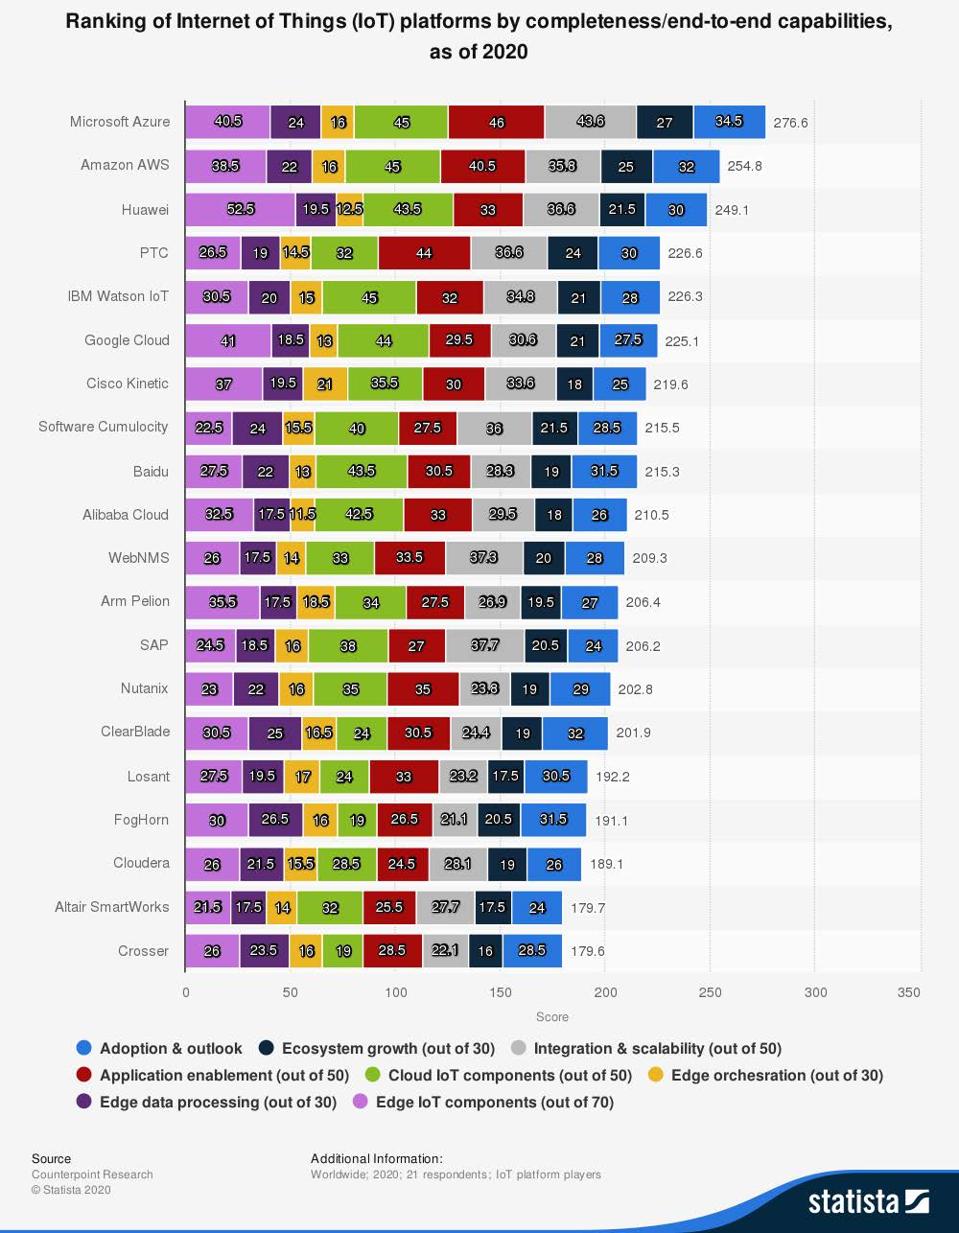
  • Microsoft Azure is the leading IoT platform worldwide by end-to-end capabilities with a total score of 276 according to Counterpoint Research. According to the methodology Counterpoint used for ranking IoT platforms, Microsoft Azure is considered a global leader in edge data processing, an increasingly important feature of IoT platforms worldwide. The ability to deliver IoT capabilities from the cloud to the edge helped Microsoft’s platform rank high in this category. Source; Statista and CounterPointResearch.com.
10 Charts That Will Change Your Perspective Of Microsoft Azure's Growth
  •  Microsoft Azure is the foundation for a Digital Supply Chain Platform that integrates supply chain partner, corporate, data & advanced analytics platforms and supply chain core transaction systems.  The ongoing pandemic is putting continued pressure on supply chains. Most manufacturing executives say that employee safety, data security, remote worker access, supply chain visibility and insights visibility are high priorities. In response to these market needs, Microsoft Supply Chain (MSC) was created on the Azure platform. The diagram below explains how Azure is integral to the Digital Supply Chain platform.
10 Charts That Will Change Your Perspective Of Microsoft Azure's Growth

Top 10 Tech Job Skills Predicted To Grow The Fastest In 2021

Top 10 Tech Job Skills Predicted To Grow The Fastest In 2021
  • According to Burning Glass Technologies, the two tech job skills paying the highest salary premiums today and in 2021 are IT Automation ($24,969) and AI & Machine Learning ($14,175).
  • The average salary premiums for the most in-demand tech skills range from $4,204 to nearly $25,000.
  • Startups valued at $1 billion or more are 33% more likely to prioritize one or several top ten tech job skills in their new hire plans versus their legacy Fortune 100-based competitors or colleagues.

These and many other fascinating insights are from Skills of Mass Disruption: Pinpointing the 10 Most Disruptive Skills in Tech, Burning Glass Technologies’ latest research study published earlier this month. Their latest study provides pragmatic, useful insights for tech professionals interested in furthering their careers and earning potential. Burning Glass Technologies is a leading job market analytics provider that delivers job market analytics that empowers employers, workers and educators to make data-driven decisions. 

Using AI To Find The Most Valuable Job Skills

Using artificial intelligence-based technologies they’ve developed, Burning Glass Technologies analyzed over 17,000 unique skills demanded across their database of over one billion historical job listings. The study aggregates then define disruptive skill clusters as those skill groups projected to grow the fastest, are most undersupplied and provide the highest value. For additional details regarding their methodology, please see page 8 of the report.

The research study is noteworthy because it explains how essential acquiring skills is to translating new technologies’ benefits into business value. They’ve also taken their analysis a step further, providing technical professionals with additional insights they need to plan their personal development and careers.

Key takeaways from their analysis include the following:

  • IT Automation expertise can earn technical professionals a $24,969 salary premium, the most lucrative of all tech job skills to have in 2021. Burning Glass Technologies defines IT Automation as the skills related to automating and orchestrating digital processes and workflows. Six of the ten job skills are marketable enough to drive technical professionals’ salaries above $10,000 a year. At an average salary uplift of $8,851, proactive security (cybersecurity) job skills’ market value seems low. Future surveys in 2021 will most likely reflect the impact of the SolarWinds breach on demand for this skill set. The following graphic compares the average salary premium by tech job skill area.
Top 10 Tech Job Skills Predicted To Grow The Fastest In 2021
Skills of Mass Disruption: Pinpointing the 10 Most Disruptive Skills in Tech by Burning Glass Technologies
  • Software Dev. Methodologies (DevOps) expertise is the most marketable going into 2021, with 634,600 open positions available in North America based on Burning Glass Technologies’ analysis. Employers initiated 1,714,483 job postings requesting at least one disruptive skill area between December 2019 and November 2020. With each skill predicted to grow at least 17%, technical professionals have several lucrative options for their personal and professional development plans. The following graphic compares job openings by skill areas for the time frame of the study:
Top 10 Tech Job Skills Predicted To Grow The Fastest In 2021
Skills of Mass Disruption: Pinpointing the 10 Most Disruptive Skills in Tech by Burning Glass Technologies
  • Quantum Computing, Connected Technologies, Fintech and AI & Machine Learning expertise are predicted to be the fastest-growing tech job skills in 2021 and beyond. Demand for technical professionals skilled in building and optimizing quantum computers and their applications will be in high demand for the next five years based on the study’s findings. Connected Technologies refers to skills related to the Internet of Things and connected physical tools and the telecommunications infrastructure needed to enable them. Fintech skills are related to technologies, including blockchain and others, that make financial transactions more efficient and secure. The following graphic compares the top ten tech job skills predicted to grow the fastest in 2021.
Top 10 Tech Job Skills Predicted To Grow The Fastest In 2021
Skills of Mass Disruption: Pinpointing the 10 Most Disruptive Skills in Tech by Burning Glass Technologies
  • AI & Machine Learning, Cloud Technologies, Parallel Computing and Proactive Security (Cybersecurity) are the most distributed across industries, translating into more diverse job opportunities for technical professionals with these skills. Professional Services leads all industries in demand for nine of the ten tech job skills, except Parallel Computing, the most in-demand skill in Manufacturing. Factors contributing to Professional Services leading all industries in demand for technical job skills include the following factors. First, their business models need to continue pivoting fast to stabilize during the pandemic. Second, better risk and compliance controls of remote operations are urgently needed. Third, better visibility into services costs across all systems to ensure financial reporting accuracy is a must-have, according to the CFOs I spoke with regarding the survey results. The following graphic compares demand for tech skills by industry sector.
Top 10 Tech Job Skills Predicted To Grow The Fastest In 2021
Skills of Mass Disruption: Pinpointing the 10 Most Disruptive Skills in Tech by Burning Glass Technologies
  • Demand for AI and Machine Learning skills is growing at a 71% compound annual growth rate through 2025, with 197,810 open positions today. Technical professionals with job skills in this area see salary premiums of $14,175. Top positions include Data Scientist, Software Developer, Network Engineer, Network Architect, Data Engineer and Senior Data Scientist.
Top 10 Tech Job Skills Predicted To Grow The Fastest In 2021
Skills of Mass Disruption: Pinpointing the 10 Most Disruptive Skills in Tech by Burning Glass Technologies
  •  Positions requiring IT Automation job skills are predicted to grow 59% over the next five years and have 282,380 positions open today. Besides being the most lucrative job skillset to have, IT Automation job skills lead to positions including Software Developer, DevOps Engineer, Senior Software Developer, Systems Engineer and Java Developer or Engineer.
Top 10 Tech Job Skills Predicted To Grow The Fastest In 2021
Skills of Mass Disruption: Pinpointing the 10 Most Disruptive Skills in Tech by Burning Glass Technologies

The Best Cloud Computing Companies And CEOs To Work For In 2019 Based On Glassdoor

  • SysdigFivetranNuxeoCloudianMendixStreamSetsZscalerZohoSAPOutSystemsKony, and Netskope are the most likely to be recommended by their employees to friends looking for a cloud computing company to work for in 2019.
  • Cloud platform and development companies dominate the highest rated cloud businesses when indexed by the percent of employees who would recommend their company to a friend.
  • Taken together, the 12 CEOs leading the top-rated cloud computing companies are approved by 98% of employees as of March 3, 2019, on Glassdoor. CEOs in this group include Thomas Hogan of Kony, Paulo Rosado of OutSystems, Bill McDermott of SAP, and Sridhar Vembu of Zoho.

These and many other insights are from an analysis completed today comparing Computer Reseller News’ 100 Coolest Cloud Computing Vendors of 2019 by their respective Glassdoor scores. The Computer Reseller News annual list of the 100 coolest cloud computing vendors is an impartial, 3rd party benchmark of the fastest-growing and most likely to hire cloud businesses expanding today.  By far the most common request from Forbes readers is which cloud computing companies are the best to work for. The goal of this analysis is to provide readers with insights into which cloud computing companies best fit their skills and at the same time have a strong reputation based on feedback from existing employees.

Indexing the most interesting and fastest growing cloud computing companies by their Glassdoor scores and reputations is a great way to begin defining a long-term career growth strategy. One factor not quantified is how well of a fit an applicant is to company culture. Take every opportunity for in-person interviews, read Glassdoor ratings often and observe as much as possible about daily life in companies of interest to see if they are a good fit for your skills and strengths.

Using the 2019 CRN list as a baseline to compare the Glassdoor scores of the (%) of employees who would recommend this company to a friend and (%) of employees who approve of the CEO, the table below is provided. You can find the original dataset here. There are 15 companies on the CRN list that don’t have that many or any entries on Glassdoor, and they are excluded from the rankings shown below. You can find their mention in the original dataset. If the image below is not visible in your browser, you can view the rankings here.

The highest rated CEOs on Glassdoor as of March 3, 2019, include the following. Please click on the graphic and dataset to expand for easier reading.

The original dataset is shown below:

By 2020 83% Of Enterprise Workloads Will Be In The Cloud

  • Digitally transforming enterprises (63%) is the leading factor driving greater public cloud engagement or adoption today.
  • 66% of IT professionals say security is their most significant concern in adopting an enterprise cloud computing strategy.
  • 50% of IT professionals believe artificial intelligence and machine learning are playing a role in cloud computing adoption today, growing to 67% by 2020.
  • Artificial Intelligence (AI) and Machine Learning will be the leading catalyst driving greater cloud computing adoption by 2020.

These insights and findings are from LogicMonitor’s Cloud Vision 2020: The Future of the Cloud Study (PDF, free, opt-in, 9 pp.). The survey is based on interviews with approximately 300 influencers LogicMonitor interviewed in November 2017. Respondents include Amazon Web Services AWS re:Invent 2017 attendees, industry analysts, media, consultants and vendor strategists. The study’s primary goal is to explore the landscape for cloud services in 2020. While the study’s findings are not statistically significant, they do provide a fascinating glimpse into current and future enterprise cloud computing strategies.

Key takeaways include the following:

  • 83% Of Enterprise Workloads Will Be In The Cloud By 2020. LogicMonitor’s survey is predicting that 41% of enterprise workloads will be run on public cloud platforms (Amazon AWSGoogle Cloud PlatformIBM CloudMicrosoft Azure and others) by 2020. An additional 20% are predicted to be private-cloud-based followed by another 22% running on hybrid cloud platforms by 2020. On-premise workloads are predicted to shrink from 37% today to 27% of all workloads by 2020.

  • Digitally transforming enterprises (63%) is the leading factor driving greater public cloud engagement or adoption followed by the pursuit of IT agility (62%). LogicMonitor’s survey found that the many challenges enterprises face in digitally transforming their business models are the leading contributing factor to cloud computing adoption. Attaining IT agility (62%), excelling at DevOps (58%), mobility (55%), Artificial Intelligence (AI) and Machine Learning (50%) and the Internet of Things (IoT) adoption (45%) are the top six factors driving cloud adoption today. Artifical Intelligence (AI) and Machine Learning are predicted to be the leading factors driving greater cloud computing adoption by 2020.

  • 66% of IT professionals say security is their greatest concern in adopting an enterprise cloud computing strategy. Cloud platform and service providers will go on a buying spree in 2018 to strengthen and harden their platforms in this area. Verizon (NYSE:VZ) acquiring Niddel this week is just the beginning. Niddel’s Magnet software is a machine learning-based threat-hunting system that will be integrated into Verizon’s enterprise-class cloud services and systems. Additional concerns include attaining governance and compliance goals on cloud-based platforms (60%), overcoming the challenges of having staff that lacks cloud experience (58%), Privacy (57%) and vendor lock-in (47%).

  • Just 27% of respondents predict that by 2022, 95% of all workloads will run in the cloud. One in five respondents believes it will take ten years to reach that level of workload migration. 13% of respondents don’t see this level of workload shift ever occurring. Based on conversations with CIOs and CEOs in manufacturing and financial services industries there will be a mix of workloads between on-premise and cloud for the foreseeable future. C-level executives evaluate shifting workloads based on each systems’ contribution to new business models, cost, and revenue goals in addition to accelerating time-to-market.

  • Microsoft Azure and Google Cloud Platform are predicted to gain market share versus Amazon AWS in the next three years, with AWS staying the clear market leader. The study found 42% of respondents are predicting Microsoft Azure will gain more market share by 2020. Google Cloud Platform is predicted to also gain ground according to 35% of the respondent base. AWS is predicted to extend its market dominance with 52% market share by 2020.

Cloud Computing Market Projected To Reach $411B By 2020

  • Worldwide public cloud services market revenue is projected to grow 18.5% in 2017 reaching $260.2B, up from $219.6B in 2016.
  • 2016 worldwide SaaS revenue exceeded Gartner’s previous forecast by $48.2B.
  • SaaS revenue is expected to grow 21% in 2017 reaching $58.6B by the end of this year.
  • Infrastructure as a Service (IaaS) is projected to grow 36.6% in 2017 alone, reaching $34.7B this year making this area the fastest growing of all cloud services today.

Gartner’s latest worldwide public cloud services revenue forecast published earlier this month predicts Infrastructure-as-a-Service (IaaS), currently growing at a 23.31% Compound Annual Growth Rate (CAGR), will outpace the overall market growth of 13.38% through 2020. Software-as-a-Service (SaaS) revenue is predicted to grow from $58.6B in 2017 to $99.7B in 2020. Taking into account the entire forecast period of 2016 – 2020, SaaS is on pace to attain 15.65% compound annual growth throughout the forecast period, also outpacing the total cloud market. The following graphic compares revenue growth by cloud services category for the years 2016 through 2020. Please click on the graphic to expand it for easier reading.

Catalysts driving greater adoption and correspondingly higher CAGRs include a shift Gartner sees in infrastructure, middleware, application and business process services spending. In 2016, Gartner estimates approximately 17% of the total market revenue for these areas had shifted to the cloud. Gartner predicts by 2021, 28% of all IT spending will be for cloud-based infrastructure, middleware, application and business process services. Another factor is the adoption of Platform-as-a-Service (PaaS). Gartner notes that enterprises are confident that PaaS can be a secure, scalable application development platform in the future.  The following graphic compares the compound annual growth rates (CAGRs) of each cloud service area including the total market. Please click on the graphic to expand it for easier reading.

Source: Gartner Forecasts Worldwide Public Cloud Services Revenue to Reach $260 Billion in 2017

Roundup Of Cloud Computing Forecasts, 2017

  • Cloud computing is projected to increase from $67B in 2015 to $162B in 2020 attaining a compound annual growth rate (CAGR) of 19%.
  • Gartner predicts the worldwide public cloud services market will grow 18% in 2017 to $246.8B, up from $209.2B in 2016.
  • 74% of Tech Chief Financial Officers (CFOs) say cloud computing will have the most measurable impact on their business in 2017.

Cloud platforms are enabling new, complex business models and orchestrating more globally-based integration networks in 2017 than many analyst and advisory firms predicted. Combined with Cloud Services adoption increasing in the mid-tier and small & medium businesses (SMB), leading researchers including Forrester are adjusting their forecasts upward. The best check of any forecast is revenue.  Amazon’s latest quarterly results released two days ago show Amazon Web Services (AWS) attained 43% year-over-year growth, contributing 10% of consolidated revenue and 89% of consolidated operating income.

Additional key takeaways from the roundup include the following:

  • Wikibon is predicting enterprise cloud spending is growing at a 16% compound annual growth (CAGR) run rate between 2016 and 2026. The research firm also predicts that by 2022, Amazon Web Services (AWS) will reach $43B in revenue, and be 8.2% of all cloud spending. Source: Wikibon report preview: How big can Amazon Web Services get?

Wikibon Worldwide Enterprise IT Projection By Vendor Revenue

Wikibon Worldwide Enterprise IT Projection By Vendor Revenue

Rapid Growth of Cloud Computing, 2015–2020

Rapid Growth of Cloud Computing, 2015–2020

Worldwide Public Cloud Services Forecast (Millions of Dollars)

Worldwide Public Cloud Services Forecast (Millions of Dollars)

  • By the end of 2018, spending on IT-as-a-Service for data centers, software and services will be $547B. Deloitte Global predicts that procurement of IT technologies will accelerate in the next 2.5 years from $361B to $547B. At this pace, IT-as-a-Service will represent more than half of IT spending by the 2021/2022 timeframe. Source: Deloitte Technology, Media and Telecommunications Predictions, 2017 (PDF, 80 pp., no opt-in).

Deloitte IT-as-a-Service Forecast

Deloitte IT-as-a-Service Forecast

  • Total spending on IT infrastructure products (server, enterprise storage, and Ethernet switches) for deployment in cloud environments will increase 15.3% year over year in 2017 to $41.7B. IDC predicts that public cloud data centers will account for the majority of this spending ( 60.5%) while off-premises private cloud environments will represent 14.9% of spending. On-premises private clouds will account for 62.3% of spending on private cloud IT infrastructure and will grow 13.1% year over year in 2017. Source: Spending on IT Infrastructure for Public Cloud Deployments Will Return to Double-Digit Growth in 2017, According to IDC.

Worldwide Cloud IT Infrastructure Market Forecast

Worldwide Cloud IT Infrastructure Market Forecast

  • Platform-as-a-Service (PaaS) adoption is predicted to be the fastest-growing sector of cloud platforms according to KPMG, growing from 32% in 2017 to 56% adoption in 2020. Results from the 2016 Harvey Nash / KPMG CIO Survey indicate that cloud adoption is now mainstream and accelerating as enterprises shift data-intensive operations to the cloud.  Source: Journey to the Cloud, The Creative CIO Agenda, KPMG (PDF, no opt-in, 14 pp.)

Cloud investment by type today and in three years

Cloud investment by type today and in three years

AWS Segment Financial Comparison

AWS Segment Financial Comparison

  • In Q1, 2017 AWS generated 10% of consolidated revenue and 89% of consolidated operating income. Net sales increased 23% to $35.7 billion in the first quarter, compared with $29.1 billion in first quarter 2016. Source: Cloud Business Drives Amazon’s Profits.

Comparing AWS' Revenue and Income Contributions

Comparing AWS’ Revenue and Income Contributions

  • RightScale’s 2017 survey found that Microsoft Azure adoption surged from 26% to 43% with AWS adoption increasing from 56% to 59%. Overall Azure adoption grew from 20% to 34% percent of respondents to reduce the AWS lead, with Azure now reaching 60% of the market penetration of AWS. Google also increased adoption from 10% to 15%. AWS continues to lead in public cloud adoption (57% of respondents currently run applications in AWS), this number has stayed flat since both 2016 and 2015. Source: RightScale 2017 State of the Cloud Report (PDF, 38 pp., no opt-in)

Public Cloud Adoption, 2017 versus 2016

Public Cloud Adoption, 2017 versus 2016

  • Global Cloud IT market revenue is predicted to increase from $180B in 2015 to $390B in 2020, attaining a Compound Annual Growth Rate (CAGR) of 17%. In the same period, SaaS-based apps are predicted to grow at an 18% CAGR, and IaaS/PaaS is predicted to increase at a 27% CAGR. Source: Bain & Company research brief The Changing Faces of the Cloud (PDF, no opt-in).

60% of IT Market Growth Is Being Driven By The Cloud

60% of IT Market Growth Is Being Driven By The Cloud

  • 74% of Tech Chief Financial Officers (CFOs) say cloud computing will have the most measurable impact on their business in 2017. Additional technologies that will have a significant financial impact in 2017 include the Internet of Things, Artificial Intelligence (AI) (16%) and 3D printing and virtual reality (14% each). Source: 2017 BDO Technology Outlook Survey (PDF), no opt-in).

CFOs say cloud investments deliver the greatest measurable impact

CFOs say cloud investments deliver the greatest measurable impact

Cloud investments are fueling new job throughout Canada

Cloud investments are fueling new job throughout Canada

  • APIs are enabling persona-based user experiences in a diverse base of cloud enterprise As of today there are 17,422 APIs listed on the Programmable Web, with many enterprise cloud apps concentrating on subscription, distributed order management, and pricing workflows.  Sources: Bessemer Venture Partners State of the Cloud 2017 and 2017 Is Quickly Becoming The Year Of The API Economy. The following graphic from the latest Bessemer Venture Partners report illustrates how APIs are now the background of enterprise software.

APIs are fueling a revolution in cloud enterprise apps

APIs are fueling a revolution in cloud enterprise apps

Additional Resources:

Analytics, Data Storage Will Lead Cloud Adoption In 2017

  • cioU.S.-based organizations are budgeting $1.77M for cloud spending in 2017 compared to $1.30M for non-U.S. based organizations.
  • 10% of enterprises with over 1,000 employees are projecting they will spend $10M or more on cloud computing apps and platforms throughout this year.
  • Organizations are using multiple cloud models to meet their business’s needs, including private (62%), public (60%), and hybrid (26%).
  • By 2018 the typical IT department will have the minority of their apps and platforms (40%) residing in on-premise systems.

These and many other insights are from IDG’s Enterprise Cloud Computing Survey, 2016. You can find the 2016 Cloud Computing Executive Summary here and a presentation of the results here.  The study’s methodology is based on interviews with respondents who are reporting they are involved with cloud planning and management across their organizations. The sampling frame includes audiences across six IDG Enterprise brands (CIO, Computerworld, CSO, InfoWorld, ITworld and Network World) representing IT and security decision-makers across eight industries. The survey was fielded online with the objective of understanding organizational adoption, use-cases, and solution needs for cloud computing. A total of 925 respondents were interviewed to complete the study.

Key takeaways include the following:

  • The cloud is the new normal for enterprise apps, with 70% of all organizations having at least one app in the cloud today. 75% of enterprises with greater than 1,000 employees have at least one app or platform running in the cloud today, leading all categories of adoption measured in the survey. 90% of all organizations today either have apps running in the cloud are planning to use cloud apps in the next 12 months, or within 1 to 3 years. The cloud has won the enterprise and will continue to see the variety and breadth of apps adopted accelerating in 2017 and beyond.

use-of-cloud-technology-continuously-expanding


  • Business/data analytics and data storage/data management (both 43%) are projected to lead cloud adoption in 2017 and beyond. 22% of organizations surveyed are predicting that business/data analytics will be the leading cloud application area they will migrate to in the next twelve months. 21% are predicting data storage/data management apps are a high priority area for their organizations’ cloud migration plans in 2017. Three of the market leaders in analytics are Tableau, QlikView and Microsoft Power BI. They are analyzed in this recent post from SelectHub, accessible here.

data-storage-and-analytics-moving-to-the-cloud


  • 28% of organizations’ total IT budgets is dedicated to cloud computing next year. Of that, 45% is allocated to SaaS, 30% to IaaS and 19% to PaaS. The average investment organizations will make in cloud computing next year is $1.62M, with enterprises over 1,000 employees projected to spend $3.03M. The average investment in cloud computing remains constant in organizations with $1.62M invested in 2014, $1.56M in 2015 and $1.62M in 2016. 10% of enterprises with over 1,000 employees are projecting they will spend $10M or more on cloud computing apps and platforms throughout this year.

cloud-budget


  • CIOs, IT architects and IT networking/management control cloud spending in the enterprise. In contrast, CEOs, CIOs, and CFOs are driving small and medium business (SMB) cloud spending this year. The following graphic compares how influential the following groups and individuals are in the cloud computing purchase process.

cloud-investment


  • Just 46% of organizations are using Application Programmer Interfaces (APIs) to integrate with databases, messaging systems, portals or storage components. 40% are using them for creating connections to the application layer of their cloud and the underlying IT infrastructures. The following graphic provides insights into how APIs are being used and which teams see the most value in them.

apis


  • In 18 months the majority of organizations’ IT infrastructures will be entirely cloud-based. IDG found that in 18 months nearly one-third (28%) of all organizations interviewed will be relying on private clouds as part of their IT infrastructure. Just over a fifth (22%) will have public cloud as part of their IT infrastructure, and 10% will be using hybrid By 2018 the typical IT department will have the minority of their apps and platforms (40%) residing in on-premise systems.

it-shifts-to-the-cloud


  • Concerns about where data is stored (43%), cloud security (41%) and vendor lock-in (21%) are the top three challenges organizations face when adopting public cloud technologies. Private and hybrid cloud adoption in organizations is also facing the challenges of cloud security and vendor lock-in. Private and hybrid cloud adoption are being slowed by a lack of the right skill sets to manage and gain the maximum value from cloud investments.

challenges

Google Getting More Aggressive In The Cloud

  • google-cloud-platformDeutsche Bank estimates Google Cloud Platform (GCP) has a $750M revenue run-rate estimate today.
  • The combined revenues of AWS, Microsoft Azure, and GCP are still less than $15B for a market penetration of just 1%-2% of the Total Available Market (TAM).
  • During the 2Q16 call, Google called out Cloud as the primary driver of the re-accelerating growth for Licensing and Other revenue, the first time the business has been called out in pole position.
  • Recent Orbitera and Apigee acquisitions underscore Google’s new focus and aggressiveness to grow GCP. Google has spent $1B+ on Cloud M&A over the past 12 months.
  • Deutsche Bank predicts GCP is preparing a series of new product announcements in September to strengthen their customer-facing roadmap further.

These and other insights are from Deutsche Bank Markets Research study, Google Getting More Aggressive In The Cloud, (client access) published 8 September 2016 by Ross Sandler Karl Keirstead, Deepak Mathivanan, Aki Aggarwal and Taylor McGinnis. Deutsche Bank found that Google is investing heavier in the cloud, making a financial commitment with over $1B in acquisitions in the past year including the recent Apigee deal. The study is based on interviews Deutsche Bank contacted with channel partners, prospects, partners, and customers. Despite the renewed focus on growth, Deutsche Bank predicts that GCP would continue to trail AWS and Microsoft Azure for the foreseeable future.

Key takeaways of the Deutsche Bank Markets Research survey include the following:

  • Deutsche Bank defines the Total Available Market (TAM) enterprise IT spend in nine categories that together account for over a $1T TAM. Deutsche Bank defines the Enterprise IT spending market by combining storage, network equipment, infrastructure software, IT outsourcing and support, data management software, BI/analytics, application software and consulting Deutsche Bank sees AWS make significant progress across a wide spectrum of their taxonomy categories.

IT Infrastructure TAM

  • GCP new product launches are concentrating on machine learning, data analytics and security, including data encryption and identity and access management. Google’s aggressiveness regarding the cloud is most visible from their new service announcements shown in the table below.  Recent announcements include SQL Server Images, where customers can now natively spin up Microsoft database instances on GCP, akin to AWS RDS for SQL Server. GCP also announced a second generation version of Cloud SQL, its cloud-hosted alternative to MySQL and AWS Aurora. While all of these announcements provide GCP with greater potential to compete against AWS and Microsoft Azure, Google’s two larger competitors have formidable momentum in enterprises.

new service announcements

  • Aggressive build-out of global infrastructure locations continues. Google announced during their 4Q15 earnings call they would build 12 new regions in 2016 and 2017. Of the 12 new planned GCP regions, the US Western region in Oregon opened in July 2016, and Google has said that the new Tokyo region will be available later this year, leaving ten more regions to be added in 2017.

infrastructure

  • Google continues to believe in the importance of machine learning and artificial intelligence. Deutsche Bank interviews with GCP customers confirmed interest in using machine learning and artificial intelligence on the Cloud. Customers also perceive GCP is well ahead of AWS and Azure in this regard.
  • Google is quickly hiring enterprise sales reps in an attempt to close the sales gap between themselves and AWS & Microsoft Azure. Deutsche Bank found that Google has been “hiring very aggressively” to scale its enterprise sales rep capacity and also retrofitting existing sales reps from elsewhere in Google into GCP.
  • GCP is gaining share rapidly within the startup community. Deutsche Bank spoke with customers who estimated that 25% startups are using GCP today (with 75% on AWS), while another estimated the ratio to be 20%/80%. While both agreed that a couple of years ago only 10% of startups were using GCP (with 90% using AWS). During the GCP NEXT Asia-Pacific keynote earlier this month Google disclosed that Snapchat “is one of our largest customers,” making up to 2 million queries per second and consuming more Google bandwidth than any other organization except for YouTube.
  • Recent Orbitera and Apigee acquisitions underscore Google’s new focus and aggressiveness to grow GCP. Last month Google acquired Orbitera, a small cloud commerce platform. Orbitera simplifies the buying and selling of cloud-based software by providing vendors with packaging and provisioning, billing, and marketplace solutions on AWS and Azure. Earlier this month Google acquired Apigee for $625M, which is 5.2x Apigee’s FY17e revenues of $120M. Apigee is expected to grow by 30%-35% in The company focuses on larger enterprises (Walgreens, Nike, Target, AT&T) and despite an ongoing mix shift to the cloud or SaaS model, it still has a legacy on-premise license/maintenance business.
  • Google is very focused on building relationships with all systems integration (SI) firms but that building out a GCP channel is proving to be challenging. Deutsche Bank believes that Microsoft is also finding it tough to build out it’s Azure channel, in part because many traditional partners and resellers struggle with how they can monetize Azure, given its different price points and the lower services attach rate

Businesses Adopting Big Data, Cloud & Mobility Grow 53% Faster Than Peers

  • London sykline duskOrchestrating big data, cloud and mobility strategies leads to 53% greater growth than peers not adopting these technologies.
  • 73% of midmarket companies say the complexity of their stored data requires big data analytics apps and tools to better gain insights from.
  • 41% of midmarket companies are using big data to better target marketing efforts.
  •  54% of midmarket companies’ security budgets are invested in security plans versus reacting to threats.

These and many other insights are from Dell’s second annual Global Technology Adoption Index (GTAI 2015) released last week in collaboration with TNS Research. The Global Technology Adoption Index surveyed IT and business decision makers of mid-market organizations across 11 countries, interviewing 2,900 IT and business decision makers representing businesses with 100 to 4,999 employees.

The purpose of the index is to understand how business users perceive, plan for and utilize four key technologies: cloud, mobility, security and big data. Dell released the first wave of its results this week and will be publishing several additional chapters throughout 2016. You can download Chapter 1 of the study here (PDF, no opt-in, 18 pp.).

Key take-aways from the study include the following:

  • Orchestrating big data, cloud and mobility strategies leads to 53% greater growth than peers not adopting these technologies. Midmarket organizations adopting big data alone have the potential to grow 50% more than comparable organizations. Effective use of Bring Your Own Device (BYOD) mobility strategies has the potential to increase growth by 53% over laggards or late adopters..

orchestrating tech for greater growth

  • 73% of North American organizations believe the volume and complexity of their data requires big data analytics apps and tools.  This is up from 54% in 2014, indicating midmarket organizations are concentrating on how to get more value from the massive data stores many have accumulated.  This same group of organizations believe they are getting more value out of big data this year (69%) compared to last year (64%).  Top outcomes of using big data include better targeting of marketing efforts (41%), optimization of ad spending (37%), and optimization of social media marketing (37%).

top outcomes

  • 54% of an organization’s security budget is invested in security plans versus reacting to threats. Dell & TNS Research discovered that midmarket organizations both in North America and Western Europe are relying on security to enable new devices or drive competitive advantage.  In North America, taking a more strategic approach to security has increased from 25% in 2014 to 35% today.  In Western Europe, the percentage of companies taking a more strategic view of security has increased from 26% in 2014 to 30% this year.

security strategic

  • IT infrastructure costs to support big data initiatives (29%) and costs related to securing the data (28%) are the two greatest barriers to big data adoption. For cloud adoption, costs and security are the two biggest barriers in midmarket organizations as is shown in the graphic below.

security costs

  • Cloud use by midmarket companies in France increased 12% in the last twelve months, leading all nations in the survey.  Of the 11 countries surveyed, France had the greatest increase in cloud adoption within midmarket companies.  French businesses increased their adoption of cloud applications and platforms from 70% in 2014 to 82% in 2015.

Sources: Dell Study Reveals Companies Investing in Cloud, Mobility, Security and Big Data Are Growing More Than 50 Percent Faster Than Laggards. October 13, 2015