10 Charts That Will Change Your Perspective Of Microsoft Azure’s Growth

- Microsoft Azure revenue grew 50% year-over-year in fiscal Q2, 2021, contributing to a 26% increase in Server products and cloud services revenue.
- According to the latest earnings call, more than 1,000 Microsoft customers now use Azure Arc to simplify hybrid management and run Azure services across on-premises, multi-cloud and at the edge.
- Commercial cloud gross margins increased to 71% in the latest quarter, up from 67% a year earlier.
- There are now over 60 Azure regions globally, strengthening Microsoft’s competitive global position versus Amazon Web Services.
- Microsoft reported $43.08 billion in the second fiscal quarter ended Dec. 31, up from $36.91 billion a year earlier,
These and many other insights are from Microsoft’s Fiscal Year 2021 Second Quarter Earnings Conference Call and related research. Microsoft’s early decision to double down on expanding their cloud platform by accelerating new product and services development and Azure region expansion is paying off. Azure’s revenue growth shows Microsoft is an innovation machine when it comes to the cloud.
In their latest fiscal quarter, Microsoft announced hundreds of new services and updates to Microsoft Azure alone. The most noteworthy are improvements to Microsoft Cloud for Healthcare, Azure Defender for SQL, Password spray detection in Azure AD Identity Protection, Azure Stack HCI, Azure Stack Edge, Azure Data Factory now being available in five new regions and many more. All Azure updates are available in an online index that provides options for finding those now available, in preview, or in development.
The following ten charts will change your perspective of Microsoft Azure’s growth:
- Intelligent Cloud delivered the highest operating income of all segments in the 2nd quarter at $6.4 billion or 36% of total consolidated operating income. This quarter, Microsoft’s success with indirect channel sales combined with more enterprise customers accelerating their cloud-first initiatives contributed to Intelligent Cloud leading all segments in operating income. The following is from the Q2, FY21 Earnings Call.

- Synergy Research Group’s latest cloud market analysis finds that Amazon and Microsoft are over 50% of the global cloud provider market, with Microsoft reaching 20% worldwide market share for the first time. Q4, 2020 enterprise spending on cloud infrastructure services was just over $37 billion, $4 billion higher than the previous quarter and up 35% from the fourth quarter of 2019. Synergy Research notes that it has taken just nine quarters for the market to double in size.

- 63% of enterprises are currently running apps on Microsoft Azure, second only to AWS. Azure is narrowing the gap with AWS in both the percentage of enterprises using it and the number of virtual machines (VMs) enterprises are running on it. 6% of enterprises are spending at least $1.2 million annually on Microsoft Azure. Source: Statista and Flexera 2020 State of the Cloud Report, page 50.

- 2020 total cloud infrastructure services spending grew 33% to $142 billion from $107 billion in 2019, according to Canalys, with Microsoft’s indirect channel business fueling their 20% market share growth. Microsoft’s dominance of indirect selling channels is evident in the level of sales enablement, sales and technical support they provide resellers. Canalys’ Chief Analyst Alastair Edwards says that “organizations are turning to trusted business partners to advise, implement, support and manage their cloud journeys and articulate the real business value of cloud migration.”

- 19% of enterprises expect to invest significantly more on Microsoft Azure in 2021, leading all other cloud vendors this year. Microsoft Azure leads all vendors when compared to the percentage change in spending this year. It’s noteworthy that 61% of all enterprises interviewed expect to increase their investments in Microsoft Azure this year, second only to Microsoft SaaS software. Source: 2021 Flexera State of Tech Report, January 2021.

- Microsoft Azure Stack is the second most-used private cloud platform by enterprises, with 35% of them currently running apps today. Azure Stack also leads all others in experimentation, with one in five enterprises, or 21%, currently in that phase of deployment. 67% of all enterprises interviewed in the 2020 Flexera State of the Cloud Report are either running Azure apps or are considering it.

- Microsoft’s centerpiece for their intelligence investment is the Microsoft Intelligent Security Graph, which processes over 630 billion authentications across our cloud services each month. Microsoft relies on the Security Graph to gain insights into normal behavior, including sign-ins and authentications and abnormal behavior, including attempted bypasses to two-factor authentication. Microsoft blocks more than 5 billion distinct malware threats per month, providing a great deal of useful data to analyze endpoints across customers’ networks. Source: Microsoft CISO Workshop 1 – Cybersecurity Briefing.

- 44.5% of enterprises say Microsoft Azure is their preferred provider for Cloud Business Intelligence (BI). Azure is considered 27% more critical to an enterprises’ Cloud BI requirements and preferences than Amazon Web Services. It’s noteworthy that 96.5% of all enterprises have a preference for Microsoft Azure BI versus its main competitors, including Google Cloud, IBM BlueMix, or Alibaba.

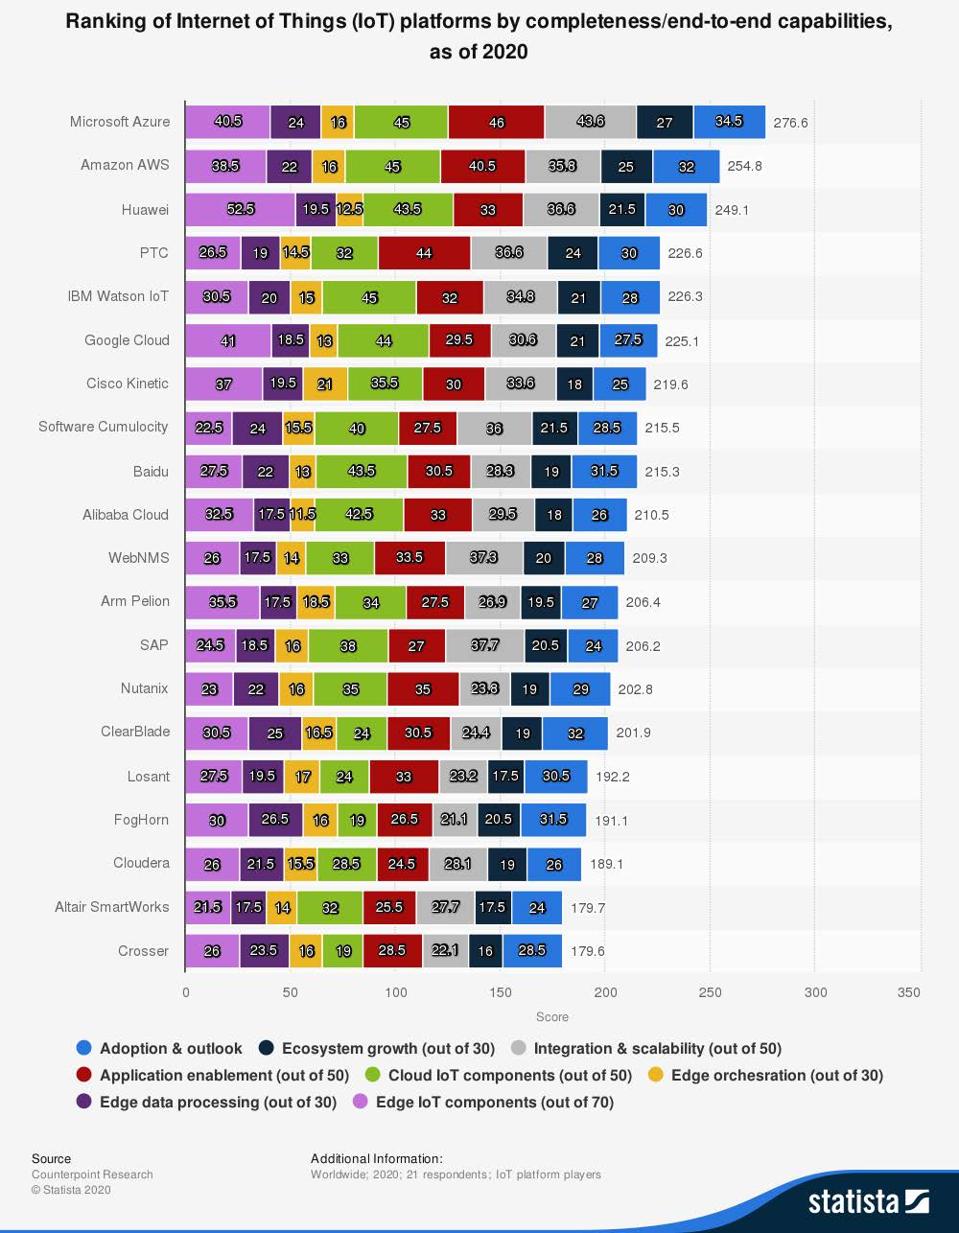
- Microsoft Azure is the leading IoT platform worldwide by end-to-end capabilities with a total score of 276 according to Counterpoint Research. According to the methodology Counterpoint used for ranking IoT platforms, Microsoft Azure is considered a global leader in edge data processing, an increasingly important feature of IoT platforms worldwide. The ability to deliver IoT capabilities from the cloud to the edge helped Microsoft’s platform rank high in this category. Source; Statista and CounterPointResearch.com.
- Microsoft Azure is the foundation for a Digital Supply Chain Platform that integrates supply chain partner, corporate, data & advanced analytics platforms and supply chain core transaction systems. The ongoing pandemic is putting continued pressure on supply chains. Most manufacturing executives say that employee safety, data security, remote worker access, supply chain visibility and insights visibility are high priorities. In response to these market needs, Microsoft Supply Chain (MSC) was created on the Azure platform. The diagram below explains how Azure is integral to the Digital Supply Chain platform.


