Skip to content

Posts from the ‘CRM & Sales Technology’ Category

Gartner’s $812.6B app software forecast sends 38% of new spending to CRM as agentic AI targets $116B of legacy apps

Gartner enterprise application software forecast 2024 to 2030 rising from $384.8 billion to $812.6 billion, stacked by CRM, ERP, other application software, email and authoring, analytic platforms, supply chain management, content services and project and portfolio management, with six KPI tiles
Gartner’s 3Q26 enterprise application software forecast by market, 2024-2030, with six tiles on the numbers that matter most. Click any chart to open it full size. Source: Gartner (G00862072, Sept. 22, 2026), analysis by softwarestrategiesblog.com.

Enterprise application software spending reaches $496.3 billion in 2026 and $812.6 billion by 2030, according to the latest Gartner application software forecast. That is a 12.8% compound annual growth rate in constant currency, revised up from 12.7% last quarter.

The headline growth rate hides a sharper story. CRM alone captures $119.2 billion, or 38%, of the $316.2 billion the market adds between 2026 and 2030. In the same report, Gartner says cross-functional agentic AI will cannibalize $116 billion from traditional application software spending by 2030.

Those two numbers are close in size, and they point to the same conclusion. Most of the new money in application software goes to the markets where agentic AI is proving value first. Legacy suites that do not embed agents compete for a shrinking slice.

I built this analysis from Gartner’s Forecast: Enterprise Application Software, Worldwide, 2024-2030, 3Q26 (G00862072), published September 22, 2026. All market, subsegment and regional figures come from the 7,567-row dataset Gartner publishes with the report. The shares, dollars added and comparisons are my calculations.

Agentic AI is the growth engine and the threat

Gartner says cumulative spending between 2026 and 2030 will exceed $3.2 trillion, “fueled by the transition from Generative AI to Agentic AI.” The dataset totals $3,227 billion over those five years.

Gartner expects business leaders to favor applications with embedded agentic capabilities, and vendors to compete on how much functionality they deliver through agents. It warns that “legacy offerings risk rapid obsolescence.”

Early value is already showing up in three segments, according to Gartner: CRM, analytics and human capital management (HCM). Adoption starts inside functional silos such as marketing, sales and customer service, where use cases are maturing. Cross-functional integration follows once use cases prove out, the technology matures and enterprises build trust.

That second phase is where the $116 billion comes from. Gartner covers it in a separate report, Spending on Cross-Functional Agentic AI Will Cannibalize $116 Billion of Spending From Application Software Markets by 2030.

CRM takes the largest share of new spending

Bubble chart of eight enterprise application software markets comparing 2025 to 2030 CAGR with dollars added from 2026 to 2030, led by CRM adding $119.2 billion and analytic platforms growing 14.5%
Each market’s 2025-2030 CAGR against dollars added from 2026 to 2030. Bubble size shows 2030 spending. Source: Gartner (G00862072), analysis by softwarestrategiesblog.com.

CRM grows from $170.5 billion in 2026 to $289.8 billion in 2030 at a 13.8% CAGR. Its share of the total market rises from 34.4% to 35.7%.

Analytic platforms post the fastest market-level growth at 14.5%, reaching $73.8 billion. Email and authoring grows 13.6% to $77.2 billion, and supply chain management grows 13.2% to $71.5 billion. All three beat the market average.

ERP, other application software, content services and project and portfolio management all grow below 12%. Together they still add $106.5 billion, but each loses share.

Market 2025 2026 2030 CAGR 2025-2030 Added 2026-2030 Share of new spending
CRM $149.1B $170.5B $289.8B 13.8% +$119.2B 37.7%
ERP $73.5B $83.0B $130.9B 11.6% +$47.9B 15.1%
Other application software $74.6B $83.5B $128.6B 10.9% +$45.1B 14.3%
Analytic platforms $36.7B $42.3B $73.8B 14.5% +$31.5B 9.9%
Email and authoring $40.1B $47.0B $77.2B 13.6% +$30.3B 9.6%
Supply chain management $37.6B $42.8B $71.5B 13.2% +$28.7B 9.1%
Content services $18.9B $21.3B $31.9B 10.5% +$10.6B 3.4%
Project and portfolio management $5.3B $5.9B $8.8B 10.2% +$2.9B 0.9%
Total $435.8B $496.3B $812.6B 12.8% +$316.2B 100%

Spending in current U.S. dollars. CAGRs in constant currency. Dollars added and shares calculated by Software Strategies Blog from Gartner’s 3Q26 dataset (G00862072).

Cross-CRM and decision intelligence lead 23 subsegments

All 23 enterprise application software subsegments ranked by 2025 to 2030 CAGR, led by decision intelligence platforms at 20.8% and cross-CRM at 18.9%, with core manufacturing and operations management slowest at 6.7%
All 23 subsegments ranked by 2025-2030 CAGR in constant currency, with 2030 spending. Colors mark the parent market. Source: Gartner (G00862072), analysis by softwarestrategiesblog.com.

Decision intelligence platforms grow fastest, at 20.8%, and more than double from $2.7 billion in 2026 to $5.7 billion in 2030. The subsegment is small, but it sits closest to the agentic pattern Gartner describes: software that recommends or takes decisions rather than reporting on them.

Cross-CRM is the more important signal. It grows 18.9% a year and doubles from $27.5 billion to $55.7 billion. That is $28.1 billion of new spending, or 24% of CRM’s total gain. Cross-CRM is the closest thing in this dataset to the cross-functional integration Gartner expects agentic AI to drive.

Customer service and support remains the largest CRM subsegment, reaching $89.7 billion at 13.1%. Marketing reaches $68.1 billion at 12.8%. Sales grows slowest inside CRM, at 11.8%, to $50.2 billion.

Analytics and BI platforms grow 15.0% to $49.4 billion. Within supply chain management, orchestration platforms (14.3%) and procurement (14.2%) lead.

HCM carries ERP

ERP is the market where the subsegment split matters most. HCM grows 13.5% and reaches $78.5 billion by 2030, 60% of all ERP spending. It accounts for $31.7 billion, or 66%, of ERP’s $47.9 billion gain.

The rest of ERP grows slowly. Financial management systems components grow 9.7% to $41.8 billion. Enterprise asset management grows 8.0% to $4.6 billion. Core manufacturing and operations management grows 6.7% to $6.0 billion, the slowest of all 23 subsegments.

That fits Gartner’s list of where early agentic value is showing up. HCM made the list. Finance, asset management and manufacturing operations did not.

North America takes 57% of new spending

2030 enterprise application software spending by region, led by North America at $461.9 billion and 56.8% share, with Emerging Asia Pacific growing fastest at 19.2% CAGR
2030 spending by region with 2025-2030 CAGR and share of the global market. Source: Gartner (G00862072), analysis by softwarestrategiesblog.com.

North America reaches $461.9 billion in 2030, 56.8% of worldwide spending, and grows 13.1% a year. It captures $180.9 billion, or 57.2%, of the market’s new spending.

Europe grows 10.2%, the slowest of any region, and its share drops from 23.3% in 2026 to 22.0% in 2030.

The fastest growth is in Asia. Emerging Asia/Pacific grows 19.2% to $25.9 billion, and China grows 17.1% to $37.3 billion. Together they add $30.7 billion and lift their combined share from 6.6% to 7.8%.

What changed in the Gartner application software forecast

Change in 2030 enterprise application software spending in Gartner's 3Q26 forecast versus 2Q26 by market, led by content services up $1.734 billion and email and authoring up $1.719 billion
Change in 2030 spending by market vs. Gartner’s 2Q26 forecast. Dollar changes include exchange-rate effects. Source: Gartner (G00862072, Table 2), analysis by softwarestrategiesblog.com.

Gartner revised growth for only two markets. Email and authoring rose 0.5 to 0.6 percentage points a year. Content services rose 0.2 to 2.0 points a year, including 1.4 points in 2026. Gartner says growth trajectories for every other market are unchanged.

In U.S. dollars, the total forecast is $657 million lower for 2026 and $2.5 billion lower for 2027 than in 2Q26, then $3.3 billion higher by 2030. The 2030 gains are concentrated in content services (+$1.73 billion) and email and authoring (+$1.72 billion). Exchange rates explain the remaining dollar movement in markets where growth rates did not change.

Gartner also repeats a note on the war in the Middle East. It expects disruption to the Strait of Hormuz to continue into 2027 and energy prices to stay more than 50% above pre-war levels. Gartner expects the main near-term IT spending impact to be a rebalancing of sourcing strategies, vendor relationships and regional exposure, not a material reduction in spending.

A reading note

Gartner reports growth in constant currency, using 2024 exchange rates as the base. Market sizes are in current U.S. dollars, so 2026 spending rises 13.9% in dollars but 12.7% in constant currency. I use constant-currency CAGRs throughout and dollar values for sizes, dollars added and shares.

The $116 billion cannibalization figure comes from a separate Gartner report cited in this forecast. I compare it with CRM’s dollar gain to show scale, not to suggest that one offsets the other.

What software leaders should do

  • Follow the dollars, not the CAGR. CRM, ERP and other application software account for 67% of new spending. Analytics grows faster but adds less than a third as much as CRM.
  • Treat cross-CRM as the agentic beachhead. It doubles to $55.7 billion and sits where Gartner expects cross-functional agents to spread first.
  • Separate HCM from the rest of ERP. HCM delivers two-thirds of ERP’s growth. Finance, asset management and manufacturing operations vendors need an agentic story to avoid sliding below 10% growth.
  • Plan for cannibalization inside your own portfolio. Gartner’s $116 billion estimate means agentic AI will replace spending as well as add to it.
  • Weight go-to-market toward North America and fast-growing Asia. North America takes 57% of the gain. Emerging Asia/Pacific and China grow fastest. Europe grows slowest.

Frequently asked questions

How large is the enterprise application software market in 2026? Gartner forecasts $496.3 billion in end-user spending in 2026, up 12.7% in constant currency.

How large will it be in 2030? Gartner forecasts $812.6 billion in 2030, a 12.8% CAGR in constant currency from 2025 to 2030.

Which market is largest? CRM, at $289.8 billion in 2030, or 35.7% of the total.

Which segment grows fastest? Decision intelligence platforms, at a 20.8% CAGR. Among the eight markets, analytic platforms grow fastest at 14.5%.

How will agentic AI affect application software spending? Gartner says agentic AI drives growth, with early value in CRM, analytics and HCM. It also says cross-functional agentic AI will cannibalize $116 billion from traditional application software spending by 2030.

How I built this analysis

Market totals, growth revisions and quotes come from Gartner’s 3Q26 enterprise application software forecast (G00862072). Subsegment and regional figures come from the dataset Gartner publishes with the report, which covers eight markets, 23 subsegments, nine regions and 2024 to 2030. I calculated constant-currency CAGRs from 2025 to 2030, dollars added from 2026 to 2030, and market and regional shares. Charts are my own work from that data.

Earlier analysis in this series:

This post is my personal analysis of Gartner’s research and does not represent my employer.

Sources

IT And Marketing Show Strongest Interest In Adopting Gen AI First

IT, Marketing Show Strongest Interest In Adopting Gen AI First

  • Currently, 16% of organizations have implemented generative AI in production, while 44% are piloting it for potential applications.
  • Interest in deploying generative AI for production applications saw a fivefold increase from the first to the fourth quarter of 2023.
  • Healthcare, manufacturing, and education are the three industries most actively pursuing generative AI adoption.
  • A majority of organizations, 63%, deem CRM data critical to their generative AI initiatives.

These and many other insights are from Dresner Advisory Services‘ recent Generative AI Report. The advisory firm surveyed its research community of over 8,000 organizations and vendors’ customer communities. The study is global in scope, with 50% of respondents from North America, 26% from EMEA, 19% from Asia/Pacific and 6% from Latin America. Dresner’s report stands out for its in-depth and nuanced analysis of gen AI adoption across global organizations.

News about generative AI has captivated technology leaders. Demand for gen AI-related news and insights dominates many organization leaders’ time. 29% are following gen AI news updates constantly, and 30% say they often check in and see what’s new in gen AI, 24% regularly check the news. Overall, 72% of analytics and business intelligence (BI) professionals have made gen AI news a priority. North American respondents are the most diligent with constantly checking gen AI news, reflecting the region having the highest production use of gen AI.

Key takeaways from the report include the following:

Professionals in IT and marketing report plans to be the first adopters of generative AI, with 44% of IT and 36% of marketing professionals saying adopting gen AI is a primary focus. Operations/ production, sales, and C-level executives also show significant interest in adopting gen AI early. Dresner’s report states that “finance and human resources least often indicate overall interest, exceeding a majority only when aggregating their primary, secondary, and tertiary responses.”

gen ai

63% of organizations consider CRM data as critical or very important to generative AI. Finance and accounting data is considered the next most important, followed by call center and supply chain data. Dresner’s analysis found that respondents least often expect generative AI to leverage workforce (HR) data. Organizations are wary of using HR data due to privacy concerns combined with the stringent standards and safeguards on data security and its use across regulated industries today.

gen ai

Gen AI adoption across organizations accelerated rapidly in 2023. From 1Q23 to 4Q23, production use increased nearly fivefold, experimenting increased by 70%, and planned use in 12 months increased by 157%. Dresner’s research results reflect a major shift in generative AI prioritization last year. The report’s authors contend that implementation activity and funding were primarily from autonomous, decentralized sources, not from C-level mandates or sponsors, as it occurred late in fiscal years and into annual budget cycles.

gen ai

Consumer services lead gen AI production levels at 43%. Technology, business services, and healthcare have the next three highest levels of gen AI production in use today. The education industry reports the highest experimentation rate at 67%, closely followed by healthcare at 62%, while government trails at 50%. The report notes that the government also reports the highest levels for planned use beyond 12 months and no planned use.

gen ai

40% of organizations consider it critical to achieve productivity and efficiency gains from gen AI. One in three (30%) say improving customer experience and personalization is the next most critical priority, followed by improved search quality and decision-making (26%).

gen ai

Data privacy concerns are considered critical to 46% of organizations pursuing gen AI initiatives today. Legal and regulatory compliance, the potential for unintended consequences, and ethics and bias concerns are also significant. Less than half of respondents—46% and 43%, respectively—consider costs and organizational policy important to generative AI adoption.

gen ai


FinancialForce Unleashes Spring ’23 Release, Strengthening Opportunity-to-Renewal

Finding new ways to improve opportunity-to-renewal is core to any services business’s growth.

FinancialForce has long bet its business on the belief that it could streamline opportunity-to-renewal for people- and software-centered businesses better than any other vendor. In delivering their Spring ’23 release, they’re proving how adept they are at delivering new features on a faster release cadence of three major releases a year. Out of its workforce of 1,000 people, FinancialForce has 400 full-time employees in DevOps, engineering, product management, and quality and nearly 100 outside resources in R&D.

FinancialForce’s overarching goal with the Spring ’23 release is to strengthen the customer’s ability to excel at opportunity-to-renewal. The feature refresh for Spring ’23 includes 18 different areas of their platform, with the most, eight, being in Services CPQ. Dan Brown, Chief Product, and Strategy Officer at FinancialForce, says, “Opportunity-to-renewal is core to companies that deliver services. It’s an area that has been dramatically underserved by classic vendors in this space. Most are fairly product-centric, and that tends to hold companies that are service-oriented back.”

Services-as-a-Business is gaining traction

FinancialForce’s Spring ’23 release shows how Services-as-a-Business is closing gaps and improving the opportunity-to-renewal process. Tight labor markets, spiraling costs and prices due to inflation, and blind spots in opportunity-to-renewal cycles continually jeopardize services revenue. As a result, professional services and software companies relying on service revenue risk losing Annual Recurring Revenue (ARR) and seeing reduced Customer Lifetime Value for every account. The Spring ’23 release provides a more granular, 360-degree view across eight core areas of the opportunity-to-renewal process to help services businesses meet new growth challenges.

“Our new Spring ’23 release is designed to give organizations the kind of certainty they need in these very uncertain economic times,” said Scott Brown, President, and Chief Executive Officer at FinancialForce. “Given the pace at which market and business conditions change, services businesses need confidence in their ability to manage estimates, skills and resources, and solve complex problems. This new release gives organizations a complete, customer-centric view of their business to turn continuous disruption into a competitive edge.”

FinancialForce Spring '23 Release

FinancialForce’s Spring ’23 release doubles down in the areas of Service CPQ and Resource Management, which are the areas where the majority of new features have been added in the Spring ’23 release.

Improving Services CPQ process performance protects margins

FinancialForce is prioritizing Services CPQ, first introduced in the Winter ’22 release, to help customers get more in control of their margins and time management. The number and depth of new features in this area and Dan Brown’s insights into how popular Services CPQ has become with enterprise accounts demonstrate that prioritization. FinancialForce’s enterprise accounts are adopting Services CPQ to save time during sales cycles by providing their prospects with the visibility to identify resources available for quoting work, their billable rate, skills, and previous experience.

Dan Brown said that “in (quote) estimation, you now can reach into your PSA (Professional Services Automation) system and identify the resource that you’re going to quote, what’s their billable rate, what’s their skills, what’s their capabilities. A big issue our customers have is that the As Quoted versus the As Delivered are almost always materially very different.”

He continued, emphasizing, “And that’s where you end up with margin erosion, that’s where you end up with revenue leakage for our customers. Now with Services CPQ, the As Quoted and As Delivered features are tightly linked together. And that has driven enormous improvements.”

Scott Brown added, “When I was a customer, this was a big pain point. For me, the capability to connect your pre-sales activities to your post-sale delivery is a real game changer for us.”

Underscoring how vital Services CPQ is to FinancialForce’s opportunity-to-renewal strategy, the Spring ‘23 Customer Overview notes that “with usability improvements in Services CPQ, support for additional pricing and costing scenarios, and streamlined estimate export for correct Statements of Work, services teams will be able to create accurate and competitive proposals faster, leading to higher win rates on projects, with much lower risk profiles.”

FinancialForce Unleashes Spring '23 Release, Strengthening Opportunity-to-RenewalAmong the many enhancements to Services CPQ are usability enhancements to the Estimate Builder, helping to reduce errors in As Quoted and As Delivered Results.

New features to optimize resources and projects

Additional goals of the spring ’23 release are to provide customers with improved workflows for optimizing resources and streamlining project management. Given how every professional services firm and software company today is under pressure to continually find new ways to optimize resources and be more done with less, the timing of Resource Optimizer Enhancements and introducing Resource Manager Work Planner is excellent. FinancialForce allows assigning multiple resources to project enhancements, integrating with MS Outlook and Google Calendar, as well as mass deletion of pass utilization results. FinancialForce also delivers task-based scheduling of held resource requests.

FinancialForce Unleashes Spring '23 Release, Strengthening Opportunity-to-Renewal

The Spring ’23 release is designed to help enterprises optimize resources from small-scale to multi-location projects by adding Resource Work Planner and Enhanced Skills Maintenance that can scale across multiple global locations.

How FinancialForce’s Spring ’23 Release Strengthens Opportunity-to-Renewal

“This new release gives organizations a complete, customer-centric view of their business to turn continuous disruption into a competitive edge,” remarked Scott Brown during a recent briefing. FinancialForce aims to help services businesses more efficiently monetize their time and resources by concentrating their development efforts across opportunity-to-renewal.

The release shows how services companies are looking to real-time financial analytics, including new risk management features, as guardrails to keep their businesses on track to margin and profit goals. The Spring ’23 release shows FinancialForce’s view of the opportunity-to-renewal process and what strengths it can offer customers, from a new Scheduling Risk Dashboard that provides early intervention and project course corrections in real time, to streamlined estimate exports for accurate Statements of Work (SOWs).

The following table uses the opportunity-to-renewal process as a framework to put the new release into context. It compares each phase of the opportunity-to-order process, how FinancialForce defines their role, how the Spring ’23 release strengthens each area, what the people and software-oriented benefits are, along with their leading customer references. You can also download a copy of the Opportunity-to-Renewal Process comparison here.

FinancialForce Spring '23 Release

FinancialForce Services-as-a-Business Is What Their Customers Need To Drive Growth

services, FinancialForce services-as-a-business

Service businesses must keep finding new ways to add value to existing clients while removing barriers that slow growth. Overcoming the challenges of outdated HR planning and human resource management (HRM), contract management, and CRM systems are table stakes for staying competitive.

FinancialForce’s Summer 22 release aims to turn those weaknesses into strengths with one of the most comprehensive releases they’ve had lately. “Organizations continue to be buffeted by market disruptions, from spiraling inflation to new COVID variants and unanticipated supply chain issues,” said Scott Brown, President and Chief Executive Officer of FinancialForce. “Our new Services-as-a-Business approach delivers the automation, intelligence, and innovation that services organizations need to become more agile so they can expertly turn disruption into opportunity.”

Improving Opportunity-to-Renewal Is Key  

FinancialForce’s Summer 2022 release reflects how services businesses need to gain greater visibility and control across to their opportunity-to-renewal process while growing more resilient to spiraling costs, uncertain supply chains, and chronic labor shortages. They need to take on these challenges and keep growing. FinancialForce believes its Business-as-a-Service unified platform can strengthen services’ traditionally weak areas (integrated HR, CRM, & contract management) without giving up on how fast they can react to new opportunities.

CEOs and COOs running several leading professional services firms spoken with recently say that tight labor markets, rising prices, and blind spots in the opportunity-to-renewal cycles are hurting revenue. As a result, they’re seeing a drain in Annual Recurring Revenue (ARR) and Customer Lifetime Value at risk. They also see that the blind spots in Contract Management, Configure, Price & Quote (CPQ), Resource Management, and Financial Planning & Analysis (FPA) across opportunity-to-renewal grow wider the more diverse their client bases become. What’s needed is a 360-degree view of the opportunity-to-renewal process that encompasses every aspect of service operations, from sales to delivery to customer success management, financial management, and planning.

FinancialForce Services-as-a-Business

FinancialForce’s Summer 22 release introduces Business-as-a-Service to bridge the gaps in the opportunity-to-renewal process, improving customer experiences, and driving faster growth by enabling greater real-time collaboration and visibility organization-wide.

Skills Matching & Scheduling Speed Is A Services Killer App

In the Summer 22 Release, FinancialForce strikes at the heart of what challenges services businesses face the most regarding getting staffing right. Skills matching is new in the release, providing Resource Managers with the insights they need to identify skills related to open roles as either Essential or Desirable. The goal is to bring greater accuracy and speed into the assignment process to control for costs, usage rates, and margin impacts while assigning associates to one project versus another.

FinancialForce Services-as-a-Business

Optimizing project schedules and seeing potential scheduling conflicts in real-time helps improve scheduling efficiency by identifying potential project conflicts early and alleviating them by balancing available hours.

A New Streamlined UX Pays Off For Services CPQ 

The Summer 22 release marks the first time FinancialForce ERP Cloud and Professional Services (PS) Cloud run entirely on the Salesforce Lightning Experience (LEX). During the FinancialForce analyst briefing, Heidi Minzner, Vice President, Product Management (ERP Cloud) at FinancialForce, demonstrated how users could create, manage and update line-level data on requisitions and purchase orders in a single view. Additionally, LEX is evident across the entire platform.

Of the many improvements announced in the Summer 22 release, updates to Services CPQ are noteworthy. The updated Services CPQ interface built on LEX has streamlined estimates creation and provides options for defining date-driven rates. Reflecting how services businesses need more role management capabilities, the Summer 22 release can enable role requests from templates and also supports pass-through of needed skills.

FinancialForce Services-as-a-Business

Services’ CPQ improvements are based partly on the platform’s flexibility LEX provides.

William Spice, Senior Director of Product Management says that Services CPQ and Customer Success Cloud are born in LEX, providing FinancialForce with the flexibility of using the latest Salesforce visual UI to deliver greater simplicity of workflows. “Services CPQ shows us extending the footprint across the whole services lifecycle, allowing our customers to build up a range of different estimates for professional services work, widen the selling and opportunity phase, and then seamlessly be able to transition these into a delivery model,” William said.

“Customer Success Cloud is really focused on making it simple and automatic to create playbooks, which are means for anyone across the organization to help ensure that we’re treating our customers with all the respect and impact they would expect from us. And finally, performance to scale sees us continuing to invest and make sure that our applications scale faster than any of our customers can, and focusing on enterprise-level integrations like linking out of the box with JIRA and Concur, for example,” William concluded.

Improving Opportunity-to-Renewal With More Intelligence

Services CPQ’s improvements reflect revenue managers’ need for greater visibility into their sales pipelines and more insights into the propensity to close by client. FinancialForce takes that a step further by providing insights into which factors are most and least affecting opportunity-to-renewal performance.

Current FinancialForce customers have access to dashboards that deliver utilization performance and staffing efficiency and can be configured to provide revenue forecasting. Also announced is a project burn-up dashboard that visualizes work completed and enables teams to be more cost-efficient during project delivery.

Improving Services Revenue With Real-time Visibility And Control

Business-as-a-Service is predicated on the design goal of enabling any business to migrate into providing services profitably. As a result, product-centric companies’ transition to services is commonplace. Nearly every major equipment manufacturer is now selling the value delivered by their machinery as a service.

The many improvements FinancialForce has made in their platform’s Financial Planning & Analysis (FP&A) areas reflect how this area is core to getting service revenue right. Of the many announcements made in this area of their platform, highlights include providing FP&A teams with the option of performing headcount planning at the resource level to better understand how compensation adjustments will impact future budgets. In addition, flexible budget templates for improving headcount planning alignment with company goals and objectives are now included.

Also announced is a new Planning Workspace where FP&A teams can collaborate and analyze budget information and potential scenarios. The value of having the entire platform on LEX is evident in how FP&A managers can immediately use financial data to accelerate planning cycles which also drives more accurate forecasting within the Planning Workspace. Also introduced is a new machine-learning-based component to the ERP product suite. Its Intelligent bank reconciliation solution provides accounting teams the agility to match a single bank statement transaction to multiple accounting transactions. It’s also supporting a more extensive end-to-end intelligent transaction matching that streamlines reconciliation procedures. That’s welcome news for accounting teams that need the time for more intensive tasks and would like to be free from the repetitive nature of reconciliation work.

Conclusion

FinancialForce’s decision to change its cadence from four to three releases a year shows its product strategy is delving further into where the gaps are in the opportunity-to-renewal process. Concentrating on three significant releases gives their DevOps and engineering teams the time they need to develop new features while revamping the entire platform to the Salesforce Lightning Experience (LEX). Leading with usability on Services CPQ and Customer Success Cloud makes sense as services businesses need to excel in each area to grow and retain customers. Additionally, a new UX will help accelerate the ramp-up times of new users. FinancialForce enters a new era with the Summer 22 Release, closing gaps in platform strategy while helping customers do the same.

FinancialForce’s Spring 2022 Release Defines the Future of FP&A In Services

Economic uncertainty sends shock waves throughout businesses, with service organizations seeing its brunt. The recent drastic drop-off in Netflix subscribers is a case in point. Services CFOs say there is an urgent need to track how well their overarching planning strategies linking finance and operations perform. However, getting the data to analyze has been challenging for even the largest services businesses.

As a result, CFOs need Financial Planning & Analysis (FP&A) integrated with operational planning applications to make it easier to track plan performance across all P&Ls and financials. FinancialForce’s decision to launch a fully-featured FP&A on their ERP Cloud platform shows they read the services market clearly and listen to their customers’ CFOs on what matters most.

CFOs Want To Know The Financial Impact Of Every Planning Decision

Even during economic stability, finance teams struggle to get operations planning teams the data they need to predict the financial outcomes of decisions. Line-of-business leaders look to finance to provide accurate, detailed information on the financial implications of every planning decision. By having FP&A use the same data accounting, reporting and planning have, CFOs, COOs, and their teams get greater visibility and control over every aspect of budgeting and forecasting.

One of FP&A’s greatest shortcomings in the past was relying only on siloed financial data alone with little visibility into operational planning. Financial teams need access to all available data across finance and operations to do their jobs well and create accurate forecasts. Getting FP&A right with any ERP platform needs to start with the goal of delivering integrated business planning. Sales management and their teams also need visibility into FP&A reporting and analysis to manage revenue. FinancialForce’s decades of experience on the Salesforce platform combined with the integration expertise Salesforces’ MuleSoft acquisition brought to the company four years ago will increase the probability of their FP&A solution gaining adoption.

Services companies’ CFOs are grappling with new economic uncertainties every week. As a result, they’re most interested in getting greater visibility and control over the planning process, including version control, more automated multi-planning options, and more real-time enterprise-wide collaboration, all on a single platform. FinancialForce’s DevOps and product management teams deserve credit for identifying these challenges and including them in their FP&A application delivered in the Spring 2022 release.

FinancialForce

FinancialForce’s long-awaited FP&A solution enables analysts to create multiple what-if scenarios using calculation rules and mass functions, create dynamic plans and stress-test assumptions, and better anticipate their return by area and investment.

The future of FP&A Is An Integrated Cloud

Service organizations are quicker to migrate to the cloud versus their product-based counterparts. That’s because procurement, order-to-cash, and supply chain management workflows tend to be less complex than product-based businesses. Services organizations also need financial management, procure-to-pay, and Professional Services Automation (PSA), all on the same platform to support operational planning with FP&A.

FinancialForce’s Multi-X functionality is expanded in the Spring 2022 release to simplify the consolidation of financial statements and meet the needs of multi-entity organizations. In the latest release, it’s possible to record taxes due from intercompany tax transactions, accelerating the intercompany process for taxation and reporting. The Spring 2022 release also streamlines the creation of multi-company sales invoices and simplifies consolidated financial statement preparation with consolidation group structure capabilities.

FinancialForce

Multi-X enables the recording and sharing across a multi-tier or multi-entity business.

New localization features that are essential to running a global business were added, including support for Switzerland, Denmark, Finland, and Austria, as well as enhanced business operations in Germany and Australia. In addition, multi-X supports multi-company invoicing support and advanced invoice consolidations for multi-revenue billing. Calculating and recording tax on intercompany transactions and enabling cash matching process across companies are also supported.

FP&A’s future is an integrated cloud, further validated by FinancialForce’s’ launch of ERP Cloud, Professional Services Cloud, and enhancements to its Customer Success solutions. “In today’s business environment, organizations must be able to respond to disruptions quickly while continuing to innovate and deliver tangible outcomes to their customers,” said Dan Brown, Chief Product and Strategy Officer at FinancialForce. “Our Spring 2022 release gives our customers a richer toolset to help pursue their primary goal, delivering exceptional customer outcomes while improving the customer experience across the opportunity-to-renewal journey.”

New Professional Services (PS) Cloud additions in the Spring 2022 release include customer-requested improvements to skills and resource management, services estimating, and project management capabilities. FinancialForce’s customers have also requested improved resource management to scale their efforts to train and retain their workforce. As a result, the Spring 2022 Release adds intelligent automation to the staffing process by enabling auto-assignment of resource requests that meet specific criteria and an expanded capability to model ideal staffing scenarios across a project, opportunity, or region. These enhancements improve PS Cloud’s resource optimization capabilities and enable resource managers to deploy ever larger and more complex teams efficiently and cost-effectively.

Conclusion

Services organizations are looking for cloud-based professional services ERP systems that deliver greater forecast accuracy, faster forecasting and budgeting, and improved accountability, visibility, and control. Integrated clouds are the future of FP&A for all these factors and the need all services organizations have to improve revenue and operations performance. In addition, given the growing economic uncertainty today, CFOs also want to increase better predictability and better risk management strategies while also supporting more collaboration. All these factors combined are defining the future of FP&A in an integrated cloud, which is what FinancialForce has been doing for decades on the Salesforce platform.

How Services CPQ Helps Close Revenue Gaps

How Services CPQ Helps Close Revenue Gaps

Bottom Line: Professional services (PS) organizations need to close the gaps in their CPQ selling strategies to win more deals, capture more revenue and protect margins from ongoing price pressure.

Why Services CPQ Is Too Slow Today

When PS organizations compete in sales cycles, the first competitor to have a complete quote with accurate pricing, schedules, and an engagement plan will often win. However, getting a complete quote out fast is a major challenge for most PS organizations today. Many PS organizations manually create their quotes by taking into account a broad base of factors that include the following: talent profiles of employees and the market value of their skills; utilization rates; direct and indirect engagement costs; typical gross margins by type of engagement; and, competitive pricing. The average PS organization takes six weeks to deliver a quote or proposal. John Ragsdale’s excellent recent article Automating Services Quote-to-Cash: Emergence of CPQ for Services provides useful insights into what needs to change for PS quoting and selling to increase its velocity.

Getting Services CPQ Right Is Hard

Gaps that drain revenue and margin grow wider when PS organizations attempt to use product-centric CPQ platforms to sell services. Too often, PS organizations attempt to wedge their quoting, pricing, and revenue management into a product-based CPQ system – and get mediocre results at best. Earlier in my career, I led a product management team that defined, created, and launched a quoting system for professional services inside a large IT organization. The most valuable lessons learned from that experience include the following:

  • PS bundles only work if they have simple, solid direct cost structures. Adding a synthetic SKU that represents a PS bundle only works for the most simple, automated PS engagements. Think of those PS engagements with long-standing direct cost structures that are simple, clear and easy to implement. Attempting to group PS bundles can easily lead to quoting mistakes that drain margin when a product-centric CPQ system is used for PS.
  • The greater the differences in PS revenue management, the more the need for a new CPQ platform. Many PS organizations are making a mistake by attempting to make product-centric CPQ platforms work for their unique costing, pricing, and selling needs. My team and I learned that the more a PS revenue model is unique and one-of-a-kind, the more it requires a unique CPQ platform.
  • Getting product-based CPQ rules and constraint logic right is hard in PS. Our teams’ biggest challenge in recycling IT’s CPQ app for PS was how difficult it was to get the rules-based engine to work for the wide variety of variables in a common service engagement. Rules created for transaction velocity needed to be reworked for greater variety. PS engagements didn’t follow a common logic structure like a product, making the constraint logic code only somewhat usable.
  • Only launch after CRM and Revenue Management integration is complete. Our team was handed a project that had languished in IT for nearly a year because PS selling teams wouldn’t use it. The problem was that the quoting module ran batch updates to a series of databases to get customer records and fetch the latest price tables off of a mainframe. In addition, CPQ wasn’t connected in real-time to CRM or Revenue Management.

Closing Long-Standing Services CPQ Gaps

The more a Services CPQ app can close the gaps between CRM, PSA, Revenue Management, and CPQ apps and their workflows, the more effective it will be stopping margin and revenue leakage. Having APIs that share data in real-time between CRM, PSA, and Revenue Management within each quote creation session has the potential to save thousands of hours a year. FinancialForce’s recently announced Services CPQ shows how a platform-based integration strategy works. The following graphic shows how revenue potential increases as a Services CPQ’s systems become more integrated.

How Services CPQ Helps Close Revenue Gaps

FinancialForce’s approach to taking on the challenge of providing an enterprise-grade Services CPQ is noteworthy for several reasons, including the following:

  • Real-time visibility and control of Services CPQ Effectiveness. Having Services CPQ, PSA and Revenue Management on the same Salesforce platform provides the visibility and control PS sales managers need to track quoting effectiveness by program, geography, customer segment, and rep. The more real-time the data integration across these systems the greater the potential for revenue growth in existing accounts and winning new ones.
  • Changing professional services quotes in real-time without impacting sales cycles is possible. Due to the integrated design of Services CPQ, one change made anywhere on a quote will replicate through the entire system and change all related factors immediately.
  • Getting in control of professional services engagement dates and utilization rates by associates helps reduce time-to-market and assures better time-to-customer performance. Keeping track of the myriad of factors that influence a services quote using a manually-based process is too slow for how quickly engagements are decided. Instead, having a single, unified data model that can track effectiveness and provide updates on how they impact engagement project plans is needed to excel at selling with Services CPQ. Adopting an agile CPQ strategy that relies on an integration thread to unify all systems is the secret to scaling and selling more with an agile approach to services CPQ.
  • Pricing needs to be one of the core strengths in an integrated Services CPQ platform. Realizing how a customers’ requested changes to a professional services engagement will impact costs and margins gives PS teams with an integrated system a formidable pricing advantage. FinancialForce’s approach to solving the Services CPQ challenge shows the potential to take on this challenge and provide its PS customers with the insights they need to upsell engagements – and not lose margin doing it.
  • A must-have for any Services CPQ platform is support for channel partner collaboration and team quoting. For any Services CPQ to scale up and deliver its full potential value, there needs to be support for customizing partner selling experiences while providing for team selling and quoting. FinancialForce solves this by relying on the Salesforce platform. By closing the gaps between the systems Services CPQ relies on, the channel selling teams and partners gain greater flexibility in defining customized products.

Conclusion

Services CPQ needs to scale out on a platform to achieve its full potential by providing the analytical insights to track engagement lifecycles and customer lifetime value by engagement. FinancialForce has proven they can do this in their Spring 2021 release. Taking on the most challenging aspects of a Services CPQ architecture starts by providing insights and guidance on how best to optimize the mix of associates and their utilization and billing rates, locations of each engagement, margin threshold levels, and the expected duration of each engagement. Additionally, the world’s leading professional services organizations could use an automated Services CPQ solution as many of them don’t rely on enough data, letting revenue leakage happen without knowing it.


Four Interesting Insights From Gartner 2020 CRM Market Share Update

Four Interesting Insights From Gartner 2020 CRM Market Share Update
  • “The worldwide CRM market grew from $61.6 billion in 2019.  The CRM market grew 12.6% to $69.3 billion in 2020, a strong performance but with wide variations in growth due to pandemic impacts.  However, CRM generally continues to thrive and grow above the overall software industry average rates, which were 8.8% in 2020”.
  • “Salesforce’s  CRM revenue grows by 18.8%, Reaching $13.5 billion In 2020”.
  • “SAP and Oracle each witnessed a slight decrease in market share to 5.2% and 4.4%, respectively, in 2020, down slightly from 5.7% and 4.7% in 2019”.

“The worldwide CRM market grew by 12.6% to $69.3 billion in 2020, up by $7.77 billion from 2019. CRM is the software market  and the third fastest-growing” according to the Gartner, Market Share Analysis: Customer Experience and Relationship Management Software, Worldwide, 2020, by Julian Poulter, Yanna Dharmasthira, Neha Gupta, Amarendra, 16 June 2021.

Gartner found that “Digital commerce grew at a rate of 17.1%, up from 13.2% growth in the prior year, highlighting the shift to digital”. The research firm also defined a new CRM submarket called Cross-CRM comprised of Customer Data Platform (CDP) and Voice of the Customer (VoC) spending. According to Gartner, “Customer Service and Support (CSS) also continues to be the largest segment in the overall CRM market, accounting for 35.5%share. The following graphic compares the top five vendors’ revenue by subsegments:

Four Interesting Insights From Gartner 2020 CRM Market Share Update

Additional interesting insights from Gartner latest CRM market share update include the following:

  • Five vendors comprise 35.6% of an increasingly fragmented CRM market. “Salesforce, SAP, Oracle, Adobe, and Microsoft jointly held share in the CRM market is at 35.6%, up slightly from 35.2% in 2019, while still leaving a highly fragmented 23% stake for 81 named vendors (that we track in market share) and 41.5% stake for the remaining large number of other software vendor”s. “Shopify grew 41.5% year on year, a higher rate than the previous year’s 38%”.
Four Interesting Insights From Gartner 2020 CRM Market Share Update
  • Salesforce, Microsoft, and Adobe grew faster than the market in 2020.  “Salesforce’s CRM revenue grows by 18.8%, Reaching $13.5 Billion in 2020”. Microsoft’s CRM Revenue grew by 17.5% in 2020. Sales is its largest segment with 61% of its CRM revenue and achieved 13.7% growth, above the sales average growth of 10.9% suggesting Dynamics attractive price point, integrated with Power Platform and Office and as a unified CRM suite, are appealing to buyers”. Adobe is the most significant marketing software vendor with its “CRM revenue totaling $2.4 billion in 2020 (just ahead of Salesforce at $2.35 billion), up from $2.1 billion in 2019”.
Four Interesting Insights From Gartner 2020 CRM Market Share Update
  • $55 billion of 2020 CRM sales were cloud-based, comprising 79.4% of all sales, increasing from $47.7 billion in 2019. Gartner believes that “Cloud growth was slightly slower due to the pandemic, and on-premises software (new license and software support services) still had very small growth of just over 4% up from the previous year”. Vertical market niche-based applications are sold on-premise, including those tailored to the specific needs of banking, financial services, manufacturing, and process industries’ operations.
  • “North America and Western Europe hold the largest share in the CRM market, with 59.6% and 20.7% stakes, respectively”. According to Gartner, “Mature APAC and Japan emerged as the fastest-growing regions with 19.2% and 17.5% growth rates respectively. Adoption lags in these markets compared with North America and Western Europe, and this higher growth rate shows more investment as companies catch up. At the moment however, Mature APAC and Japan together only account for about 9% of the overall CRM market share”.
  • Global spending on Customer Service and Support (CSS) grew 12.9% in 2020, down from 14.78% in 2019.   “The CSS market saw growth of 12.9% in 2020, down from 14.78% in 2019, reaching $24.6 billion, up from $21.8 billion in 2019”. “The leading vendor in the CSS segment is Salesforce , with $5.3 billion in revenue,with service being its biggest cloud, overtaking sales in 2020”, according to Gartner. The next three top vendors include Genesys, Oracle and Zendesk – with Zendesk replacing SAP at No. 4 Zendesk,  achieved revenue of $866 million and a growth rate of 25.1%”.

Source:

Gartner, ‘Market Share Analysis: Customer Experience and Relationship Management Software, Worldwide, 2020’, Julian Poulter, Yanna Dharmasthira, Neha Gupta, Amarendra, June 16, 2021 (client access required)

Salesforce Sees Surge In $1M+ Deals Powering Record Q1, FY22 Results

Salesforce Sees Surge In $1M+ Deals Powering Record Q1, FY22 Results
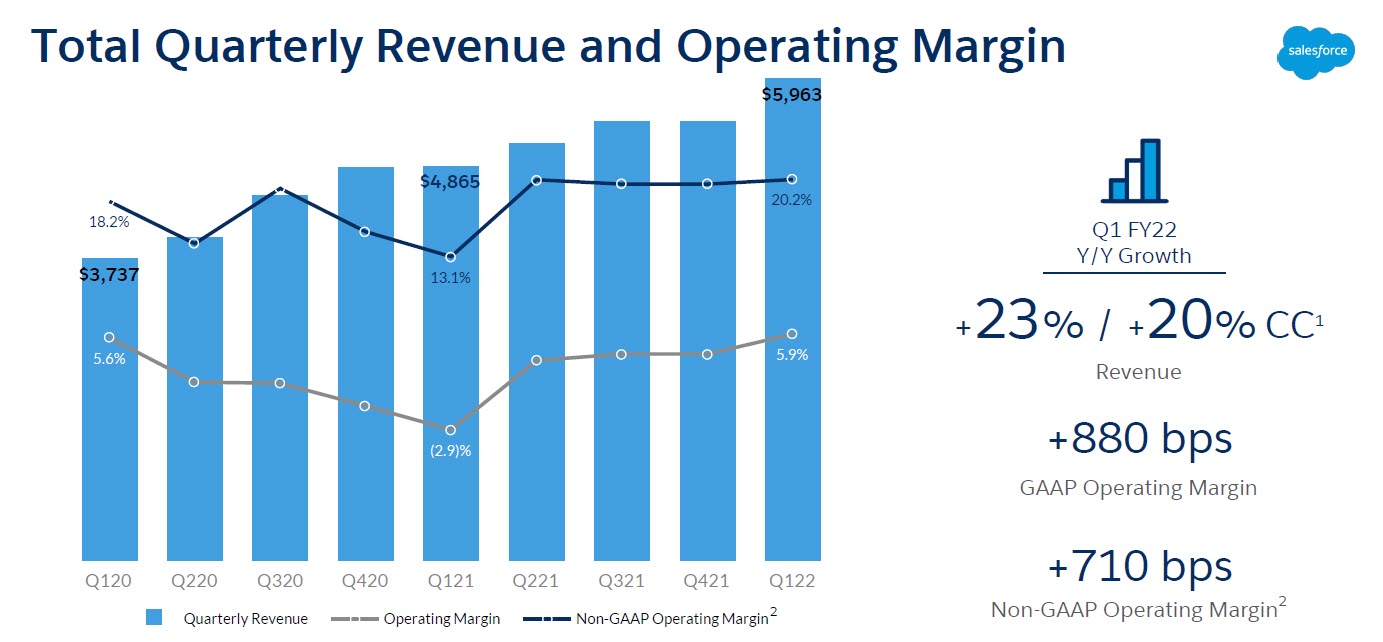
  • Salesforce Q1, FY22 revenue was $5.96B, the best quarter in the company’s history. 
  • $1M+ deals hit an all-time high and were up 120% year-over-year.  New $1M+ sales are averaging four or more Clouds, with senior management calling out Service Cloud during the earnings call as gaining strong traction in enterprises. Eight of the top 10 deals included Tableau, and five included MuleSoft.
  • FY22 Revenue guidance raised from $25.9B to $26B, approximately 22% year-over-year growth.
  • Service Cloud Q1, FY22 revenue is $1.5B, growing 20% year-over-year.
  • Tableau sales grew 38% year-over-year, reaching $394M in sales. MuleSoft grew 49% year-over-year, reaching $380M in sales in Q1, FY22.
  • The Slack acquisition is expected to close at the end of Q2, FY22.

Salesforce’s ability to successfully close new multi-cloud deals and upsell multi-cloud solutions into their sizeable installed base helped deliver the best quarterly results in its history. Service Cloud, Tableau, MuleSoft, and Government sector customer wins also contributed to a strong FY Q1, 2022. The following is the Salesforce Q1, FY22 Financial Summary from their Financial Update Q1 FY22 Presentation.


Salesforce Sees Surge In $1M+ Deals Powering Record Q1, FY22 Results

Key takeaways from their Q1, FY22 results include the following:

  • Q1, FY22 revenue is up 23% year-over-year to $5.96B. Operating margins reached 5.9%, with non-GAAP operating margins reaching 20.2% in Q1. Salesforce successfully capitalizes on its customers’ urgency to transform their businesses while providing them with proven, well-integrated apps and platform strategies to help them build new digital businesses. Salesforce is also well-positioned to increase revenue based on the growing interest in analytics apps, combined with strong demand for mobile and social apps and multi-cloud integration. Combining proven apps and platforms with their ongoing R&D work in machine learning, AI, and predictive intelligence shows Salesforce is well-positioned for long-term growth in an increasingly multi-cloud enterprise world.
Salesforce Sees Surge In $1M+ Deals Powering Record Q1, FY22 Results
  • Successful multi-cloud sales strategies are propelling double-digit growth in the platform side of the business. Five of the ten $1M+ deals Salesforce signed in Q1 included MuleSoft. The Platform business is the fastest-growing segment of Salesforce today, attaining 28% year-over-year growth. Marketing and Commerce are next at 25% year-over-year revenue growth, driven by many Salesforce customers digitally transforming their selling and service strategies online. The latest quarters’ financial results by product area show how well-integrated and revenue-generating the ExactTarget, MuleSoft, and Tableau are turning out to be today.
Salesforce Sees Surge In $1M+ Deals Powering Record Q1, FY22 Results
  • Salesforce will reach $50B in revenue by 2026, supported by their Total Available Market (TAM), reaching $204B by CY2025. During the Q1, FY22 earnings call, Marc Benioff predicted Salesforce would nearly double in size in four years, reaching $50B from $26B, which is the projected FY22 revenue target. During the earnings call, Marc Benioff also said, “but I’ll tell you that it’s awesome to see not just be number one in CRM, but we’re going to be the number one enterprise software applications company in the world passing SAP.”  The seven core product areas Salesforce compete are combining to create a TAM growing at an 11% CAGR between 2021 and 2025. 
Salesforce Sees Surge In $1M+ Deals Powering Record Q1, FY22 Results

Gartner Predicts Public Cloud Services Market Will Reach $397.4B by 2022

Gartner Predicts Public Cloud Services Market Will Reach $397.4B by 2022
  • Worldwide end-user spending on public cloud services is forecast to grow 23.1% in 2021 to total $332.3 billion, up from $270 billion in 2020.
  • Garter predicts worldwide end-user spending on public cloud services will jump from $242.6B in 2019 to $692.1B in 2025, attaining a 16.1% Compound Annual Growth Rate (CAGR).
  • Spending on SaaS cloud services is predicted to reach $122.6B this year, growing to $145.3B next year, attaining 19.3% growth between 2021 and 2022.  

These and many other insights are from Gartner Forecasts Worldwide Public Cloud End-User Spending to Grow 23% in 2021.  The pandemic created the immediate need for virtual workforces and cloud resources to support them at scale, accelerating public cloud adoption in 2020 with momentum continuing this year. Containerization, virtualization, and edge computing have quickly become more mainstream and are driving additional cloud spending. Gartner notes that CIOs face continued pressures to scale infrastructure that supports moving complex workloads to the cloud and the demands of a hybrid workforce.

Key insights from Gartner’s latest forecast of public cloud end-user spending include the following:

  • 36% of all public cloud services revenue is from SaaS applications and services this year, projected to reach $122.6B with CRM being the dominant application category. Customer Experience and Relationship Management (CRM) is the largest SaaS segment, growing from $44.7B in 2019 to $99.7B in 2025, attaining a 12.14% CAGR. SaaS-based Enterprise Resource Planning (ERP) systems are the second most popular type of SaaS application, generating $15.7B in revenue in 2019. Gartner predicts SaaS-based ERP sales will reach $35.8B in 2025, attaining a CAGR of 12.42%.
  • Desktop as a Service (DaaS) is predicted to grow 67% in 2021, followed by Infrastructure-as-a-Service (IaaS) with a 38.5% jump in revenue. Platform-as-a-Service (PaaS) is the third-fastest growing area of public cloud services, projected to see a 28.3% jump in revenue this year. SaaS, the largest segment of public cloud spending at 36.9% this year, is forecast to grow 19.3% this year. The following graphic compares the growth rates of public cloud services between 2020 and 2021.  
  • In 2021, SaaS end-user spending will grow by $19.8B, creating a $122.6B market this year. IaaS end-user spending will increase by $22.7B, the largest revenue gain by a cloud service in 2021. PaaS will follow, with end-user spending increasing $13.1B this year. CIOs and the IT teams they lead are investing in public cloud infrastructure to better scale operations and support virtual teams. CIOs from financial services and manufacturing firms I’ve recently spoken with are accelerating cloud spending for three reasons. First, create a more virtual organization that can scale; second, extend the legacy systems’ data value by integrating their databases with new SaaS apps; and third, an urgent need to improve cloud cybersecurity.

Conclusion

CIOs and the organizations they serve are prioritizing cloud infrastructure investment to better support virtual workforces, supply chains, partners, and service partners. The CIOs I’ve spoken with also focus on getting the most value out of legacy systems by integrating them with cloud infrastructure and apps. As a result, cloud infrastructure investment starting with IaaS is projected to see end-user spending increase from $82B this year to $223B in 2025, growing 38.5% this year alone. End-user spending on Database Management Systems is projected to lead all categories of PaaS through 2025, increasing from $31.2B this year to $84.8B in 2025. The following graphic compares cloud services forecasts and growth rates:

FinancialForce’s Spring 2021 Release Shows Why Being Customer-Centric Pays

FinancialForce's Spring 2021 Release Shows Why Being Customer-Centric Pays

Bottom Line: Customer revenue lifecycles are the lifeblood of any services business, making FinancialForce’s Spring 2021 release timely given the services-first revenue renaissance happening today.

The essence of an excellent services business is that it can consistently create expectations clients trust and the business regularly exceeds. Orchestrating the best people for a given project at the right time, tracking costs, revenue, and margin across all services revenue, including those associated with a client’s assets, is very challenging. Customer revenue lifecycles are in the data, yet no one can get to them because they’re hidden across multiple systems that aren’t integrated. Knowing how efficient a services business is at turning customer engagement into cash is what everyone needs to know, but no one can find. The challenge is equally as daunting for long-established services providers and those rushing into new services businesses to redefine themselves in the hope of profits that are more consistent and fewer price wars.

How Much Is Customer Engagement Is Worth?

Services businesses face the paradox of exceeding client expectations with every engagement but not knowing if extra time, resources, and staff invested are paying off with more revenue and profit. FinancialForce’s Spring 2021 release looks to solve this problem. What galvanizes the ERP, PSA, and platform announcements is a fresh intensity on customer centricity, both for the services business adopting the Spring 2021 release and the customers it’s intended to serve.

Knowing if and by how much a given customer engagement and its revenue lifecycle generate cash, and its potential is one of the core focus areas of the Spring 2021 release. It’s badly needed as many services are flying blind today, overcommitting resources for little return and too often losing control of client engagement and paying the price in lost margin and profits. FinancialForce sees that pain and wants to alleviate it with better financial visibility on all aspects of customer services revenue. FinancialForce aims to provide customer-centric financial reporting down to the revenue stream and costing measure level.  

FinancialForce's Spring 2021 Release Shows Why Being Customer-Centric Pays
Knowing every customer’s impact on revenue and profitability from all revenue streams will make managing services engagements much more accurate, easier to manage, and more profitable. 

Key Takeaways From The Spring 2021 Release

Customer centricity seen through a financial lens is the cornerstone of FinancialForce’s latest release. One of the primary goals of this release is to update more applications to Salesforce Lightning to provide FinancialForce users with a more consistent user experience across all applications.  Salesforce has been doubling down for years on Lightning and its user experience technologies, with FinancialForce reaping the benefits for over a decade. FinancialForce is transitioning their core Professional Services Automation (PSA), Billing, Accounting & Finance and Procurement, Order and Inventory Management to Lightning in this release in response to their customers wanting a consistent user experience across the entire FinancialForce suite of applications.  The Spring 2021 release reflects how FinancialForce strives to provide a real-time understanding of customer lifetime value for their ERP and PSA customers.  

Additional key takeaways include the following:

  • FinancialForce sees reducing days to close as one of the highest priorities they need to address today. The majority of new feature announcements center on how the days to close cycles can be streamlined, especially across multi-company and multisite locations across geographic and currency-specific regions of the world. Multi-company currency revaluation will help FinancialForce customers who operate across multiple geographies that operate in different currencies and will be especially useful for those clients creating new global channels and considering foreign acquisitions. Further showing the high priority they are putting on reducing days to close, the Spring 2021 release also includes automated eliminations, multi-company period close for software closes, which are designed to temporarily close out a financial report and revenue schedules that can provide a future view in revenues – a key factor in knowing customer revenue lifecycles.
  • New features and a new Lightning interface for Accounting, Billing Central, and Inventory Management simplifies complex transactions for users. FinancialForce has one of the most customer-driven product management teams in enterprise software. The depth of features they have added to inventory management, transactional and reconciliation processes for accounting, drop-ship use cases, and enhancements for adding products to billing contracts show how much FinancialForce is listening to customers.
  • AI-enhanced financial reporting that works with any Einstein data set. FinancialForce leads the Salesforce partner ecosystem when it comes to integrating Tableau CRM (formerly known as Einstein Analytics) into its platform. Now thirteen releases in, FinancialForce’s Spring 2021 release reflects the intuitive, adaptive intelligence that the product management team aims to achieve by integrating Einstein into their financial reporting workflows. 
  • Professional Services Automation (PSA) Applications Including Resource Management, Project Management, and Time & Expense upgraded to Lightning.  Transitioning three of the core PSA applications to Lightning will help broaden adoption and make them easier to upsell and cross-sell across the FinancialForce customer base. It will also help existing customers using these applications get new employees up to speed faster on them, given how much more streamlined Lightning is as an interface compared to previous versions.
  • Intelligent Staffing solves the complex challenges resource managers face when assigning the best possible associates to a given project. Designed to filter and intelligently rank potential resources based on region, practice, group skill sets, and availability, Intelligent Staffing is designed to get resource managers as close to an ideal match as possible for a given project’s requirements. This is a much-welcomed new feature by FinancialForce customers who are large-scale services providers as they’re facing the challenges of assigning the right person to the right project at the right time to ensure project success.    
  • Integration of Salesforce AI’s Next Best Action (NBA) will raise the level of project expertise at scale across customers.  Part of the customer centricity focus in Spring 2021 is focused on providing customers with new technologies and applications to share expertise and knowledge at scale. Next Best Action provides prescriptive guidance for the project manager and will see heavy use in new associate onboarding across services businesses and achieve greater corporate-wide learning at scale. This is consistent with the focus in the Spring 2021 release on bringing greater space and speed to mid-size and larger services customers.

Conclusion

FinancialForce defines customer engagement and centricity from a financial standpoint in the Spring 2021 release. Too often, services businesses commit to large-scale projects without a clear idea of the customer revenue lifecycle. With FinancialForce, they can stop and ask if the level of customer engagement they’re committing to is worth it or not – and if it isn’t, what needs to be done. FinancialForce is doubling down on user experience and accelerating time-to-close, two areas their customers want innovation to and look to them to deliver. Look for FinancialForce to scale out with more MuleSoft and Tableau integration scenarios, all aimed at capitalizing on their expertise developing on the Salesforce platform. There’s a bigger challenge to customer engagement on the horizon, and that’s providing a real-time view of financials across all customers with all available data across a business, making MuleSoft integration key to FinancialForce’s future growth.