Skip to content

Posts tagged ‘mobile apps’

5 Ways Real-Time Mobile Apps Delight Customers And Streamline Manufacturing

  • 2017-mobile-apps-in-manufacturingProviding real-time responses 24/7 on any mobile device anywhere is the new normal in 2017.
  • 54% of B2B companies selling online report that their customers are using smartphones to research purchases, and 52% say that their customers are using smartphones to buy online
  • The majority of CEOs (86%) see mobility as essential to creating and sustaining a competitive advantage.
  • Industrial manufacturing CEOs prioritize mobility (73%), cybersecurity (72%) and data mining and analysis (70%) as their top three priorities for attaining competitive advantage.

PriceWaterhouse Coopers (PWC) annually surveys global CEOs to learn about their current and future priorities, plans and technology adoption trends. PwC’s 18th Annual Global CEO Survey (free, no opt-in) is based on interviews with 1,322 CEOs located in 77 countries. The survey provides valuable insights into the strategic direction enterprises are taking with technology investments.

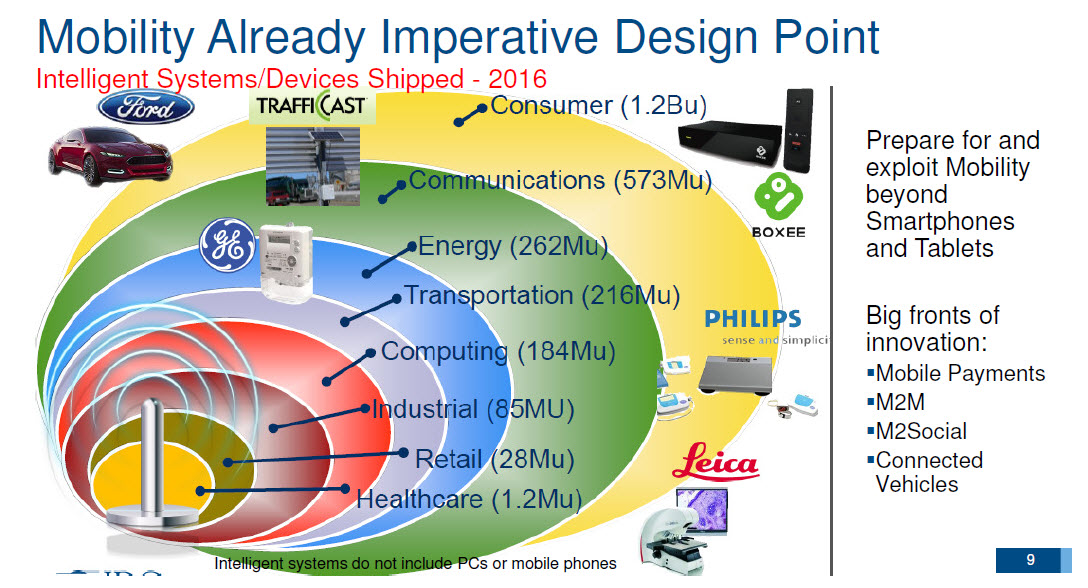
The following graphic from the report illustrates the strategic importance CEOs are placing on mobile technologies:

Competing On Accuracy, Speed And Responsiveness Is How You Win Today

CEOs at the world’s leading industrial manufacturing companies share a common focus on how to continually improve the accuracy, speed, and responsiveness of their companies using mobile technologies. A recent study by research firm Forrester shows that 54% of B2B companies selling online report that their customers are using smartphones to research purchases, and 52% say that their customers are using smartphones to buy online.

Being ready to respond with complete quotes, pricing, order status, delivery dates, updated service information on a 24/7 basis on any device anywhere is the new normal. Amazon’s ability to take orders, process, ship and deliver them in some cases all within 24 hours is driving up expectations in B2B selling too.  And a key part of making sure you can compete in 2017 and beyond is by having an integrated mobile apps strategy that provides customers the information they need when they need it.

The following are five ways real-time mobile apps delight customers and streamline manufacturing:

  1. Enabling configure, price and quoting (CPQ) apps to provide real-time updates on any device, anywhere wins more deals and keeps customers sold on doing business with you. According to a recent Gartner study, the competitor in any deal who is the first to produce a quality quote will win the deal 70% of the time. Given the competitive intensity around delivering the first, highest quality quote possible, having mobile apps that are based on real-time Salesforce and SAP integration is a must-have. From the very first interaction with any new prospect to closing a sale, having mobile apps that deliver real-time information gained through CRM and ERP integration is key.
  1. Being able to answer “When will my order ship?” anytime, anywhere on any device, at any time is what it takes to win and keep customers today. It’s time to challenge the outdated assumption that customers only want to speak with you when your legacy systems are available. The best manufacturers are modeling Amazon today, providing real-time alerts on when orders are being prepared to ship, providing e-mail and text alerts and delivery times and shipping information. Mobile apps need to be used to extend past the boundaries of legacy systems that don’t meet the minimum expectations of customers today. The CEO of an electrical machine manufacturer told me that once he was able to launch mobile apps for his customers, there was a 76% reduction in order status calls to the enterprise sales teams and 13% increase in sales the first six months these apps were available.
  1. Getting in control of quality and being able to manage customer expectations and relationships to positive outcomes with accurate data. Quality, compliance, inbound inspection and quality assurance are applications that often are isolated from CRM, ERP and customer service systems. The lack of integration between these systems wastes valuable time in getting back to customers on how best to solve quality problems and address questions they may have. That’s why it’s so important to have compliance, product quality, and quality assurance data delivered on mobile apps in a context the customer can use. Having this data available over mobile apps, enabled for customers’ use via Salesforce integration, reduces problem escalations and provides greater accuracy. Enabling quality data on mobile apps also helps to unify operations and production, giving everyone on the shop floor visibility into quality levels of order and long-term, over product lines being produced. Making data and reporting available company-wide often requires integration to SAP ERP and legacy systems, with companies including enosiX emerging as market leaders.
  1. Reducing Field Service call cancellations and delays by accurately communicating parts and staffing requirements shows respect for your customers. There is nothing more frustrating from a customer’s perspective than waiting for a field service technician to show up, only to find they don’t have the necessary parts or are told the problem was completely different than the one that needs to be solved. By enabling Salesforce integration with field service apps and providing customers with real-time alerts to their mobile devices via an app, field service calls can lead to solved problems and higher customer satisfaction faster.
  1. Providing customers with real-time updates via mobile apps on delivery dates driven by supply chain conditions helps in managing expectations while giving production planners the information they need to meet demand. Manufacturers whose business models rely on rapid inventory turns, tight production schedules, and thin margins are the leading early adopters of mobile technologies for logistics and supply chain coordination. Enabling mobile apps to provide the latest updates on Available-To-Promise (ATP), Capable-To-Promise (CTP) requires SAP integration across the Salesforce platform. Being able to provide updates on how suppliers are potentially impacting their delivery dates on orders is invaluable in managing expectations over the long-term.

Internet Of Things Will Replace Mobile Phones As Most Connected Device In 2018

  • abstract, background, banner, telecoms, communication, innovation, concept, design, icon, internet of things, internet, computer, innovate, innovative, ball, circle, sphere, circular, social, data, access, wireless, connection, pattern, global, world map, networking, hexagon, circuit, electric, electronics, microchip, power, gradient, blue, vector, illustration, logo,Internet of Things (IoT) sensors and devices are expected to exceed mobile phones as the largest category of connected devices in 2018, growing at a 23% compound annual growth rate (CAGR) from 2015 to 2021.
  • By 2021 there will be 9B mobile subscriptions, 7.7B mobile broadband subscriptions, and 6.3B smartphone subscriptions.
  • Worldwide smartphone subscriptions will grow at a 10.6% CAGR from 2015 to 2012 with Asia/Pacific (APAC) gaining 1.7B new subscribers alone.

These and other insights are from the 2016 Ericcson Mobility Report (PDF, no opt-in). Ericcson has provided a summary of the findings and a series of interactive graphics here. Ericcson created the subscription and traffic forecast baseline this analysis is based on using historical data from a variety of internal and external sources. Ericcson also validated trending analysis through the use of their planning models. Future development is estimated based on macroeconomic trends, user trends (researched by Ericsson ConsumerLab), market maturity, technology development expectations and documents such as industry analyst reports, on a national or regional level, together with internal assumptions and analysis.In addition, Ericsson regularly performs traffic measurements in over 100 live networks in all major regions of the world. For additional details on the methodology, please see page 30 of the study.

Key takeaways from the 2016 Ericcson Mobility Report include the following:

  • Internet of Things (IoT) sensors and devices are expected to exceed mobile phones as the largest category of connected devices in 2018, growing at a 23% compound annual growth rate (CAGR) from 2015 to 2021. Ericcson predicts there will be a total of approximately 28B connected devices worldwide by 2021, with nearly 16B related to IoT. The following graphic compares cellular IoT, non-cellular IoT, PC/laptop/tablet, mobile phones, and fixed phones connected devices growth from 2015 to 2021.

Internet of Things Forecast

  • 400 million IoT devices with cellular subscriptions were active at the end of 2015, and Cellular IoT is expected to have the highest growth among the different categories of connected devices, reaching 1.5B connections in 2021. Ericcson cites the growth factors of 3GPP standardization of cellular IoT technologies and cellular connections benefitting from enhancements in provisioning, device management, service enablement and security. The forecast for IoT connected devices: cellular and non-cellular (billions) is shown

IoT Connected Devices

  • Global mobile broadband subscriptions will reach 7.7B by 2021, accounting for 85% of all subscriptions. Ericcson is predicting there will be 9B mobile subscriptions, 7.7B mobile broadband subscriptions, and 6.3B smartphone subscriptions by 2021 as well. The following graphic compares mobile subscriptions, mobile broadband, mobile subscribers, fixed broadband subscriptions, and mobile CPs, tablets and mobile routers’ subscription growth.

mobile subscription growth

  • Worldwide smartphone subscriptions will grow at a 10.6% compound annual growth rate (CAGR) from 2015 to 2012. Ericcson predicts that the Asia/Pacific (APAC) region will gain 1.7B new subscribers. The Middle East and Africa will have smartphone subscription rates will increase more than 200% between 2015–2021. The following graphic compares growth by global region.

smartphone subscriptions

  • Mobile subscriptions are growing around 3% year-over-year globally and reached 7.4B in Q1 2016. India is the fastest growing market regarding net additions during the quarter (+21 million), followed by Myanmar (+5 million), Indonesia, (+5 million), the US (+3 million) and Pakistan (+3 million). The following graphic compares mobile subscription growth by global region for Q1, 2016.

Mobile subscriptions Q1

  • 90% of subscriptions in Western Europe and 95% in North America will be for LTE/5G by 2021. The Middle East and Africa will see a dramatic shift from 2G to a market where almost 80% of subscriptions will be for 3G/4G. The following graphic compares mobile subscriptions by region and technology.

Mobile technology by region

  • Mobile video traffic is forecast to grow by around 55% annually through 2021, accounting for nearly 67% of all mobile data traffic. Social networking traffic is predicted to attain a 41% CAGR from 2015 to 2021. The following graphic compared the growth of mobile traffic by application category and projected mobile traffic by application category per month.

mobile video traffic

  • Ericcson also provided mobile subscription, traffic per device, mobile traffic growth forecast, and monthly data traffic per smartphone. The summary table is shown below:

summary table

Gartner’s Mobile App Store Forecast Predicts $26B in Sales, 102B Downloads in 2013

App-store-300x209Gartner’s latest Mobile App Store Worldwide Forecast predicts annual downloads will increase 59.38% from 64 billion in 2012 to 102 billion in 2013.  Worldwide revenue is forecast to also increase 44.45%, from $18B in 2012 to $26B in 2013.

Here are additional key take-aways from the Gartner Mobile App Store Forecast that was published this week:

  • Free applications are forecast to be 91% of all downloads in 2013, increasing to 94.5% by 2017.  Paid-for downloads will grow at a Compound Annual Growth Rate (CAGR) of 14.22% from 2012 through 2017.  The following table provided in the Mobile App Store Forecast announcement this week provides an overview of free and paid-for downloads by year.
  • In-app purchases (IAP) are growing at a 27.83% Compound Annual Growth Rate (CAGR), increasing from 11% of revenue in 2012, projected to increase to 48% of app store revenue by 2017. IAP purchases are also projected to deliver 17% of store revenue in 2013, increasing to 48% in 2017.  At the projected rate of growth in this forecast, it is reasonable to assume IAP will surpass paid-for and advertising-based approaches to downloading.
  • 90% of global downloads in 2017 will be from Apple iOS and Google Android app stores.  Gartner cites the large developer communities and expanding ecosystems for each of these mobile app stores as being catalysts of their growth.
  • Average monthly downloads per Apple iOS device is projected to decline from 4.9 in 2013 to 3.9 in 2017.  Gartner is also forecasting Google Android average monthly downloads to drop from 6.2 in 2013 to 5.8 in 2017.

Roundup Of Mobile Apps & App Store Forecasts, 2013

mobile app developmentFaced with shorter time-to-market schedules, challenging cost constraints, and ever-increasing customer expectations, manufacturers are accelerating their use of mobility applications. They’re also using them to galvanize production, finance and selling strategies into a unified direction so customers’ expectations can better set and exceeded.

One manufacturer’s CIO summed it up well when he said they hit an inflexion point when their marketing analytics showed over 60% of dealers were looking up product and pricing data on their smartphones and tablets instead of their laptops, a 4X increase in just five months.

The following is a roundup of mobile apps and app store forecasts reflects the urgency all enterprises, including manufacturers, have to get results from their mobility strategies:

mobile application usage

  • 84% of smartphone shoppers use their phones while in a physical store and 30% use their smartphones to find information instead of asking store employees. according to a study released this month from Google.  The study, How Mobile Is Transforming the Shopping Experience in Stores, can be downloaded here. The study also found that 65% prefer mobile sites and search, and 35% prefer apps, not surprising for a study sponsored by Google.  There are several interesting findings in the report, including the finding the in-store price comparisons are the most common mobile activity across the eight categories included in the study.

In store price comparisons

market-shares1

  • IDC’s prediction of how mobility will drive intelligent systems adoption, in addition to device management research on smartphone and tablet adoption is covered in the presentation, The Mobility Game Changer; Why The Workplace Will Never Be The Same. The following graphic shows IDC”s forecast of mobile-based intelligent device shipments by market and industry.

mobility analysis

Mobile App Store Forecasts

  •  90% of global mobile app store downloads in 2013 are forecast to be free, increasing to 93% in 2017.  73.2B free downloads will occur in 2013, increasing to 287.9B by 2017.  Paid-for downloads will increase from 8.1B in 2013 to 21.6B in 2017.  Source: Gartner Market Trends: Mobile App Stores, Worldwide, 2012.
  • In-app purchase will drive 41% of the store revenue in 2016. While the market is moving toward free and low-priced apps, in-app purchase will increase in both the number of downloads and in the contribution to the store revenue. As a result, we see a shift in user spending from upfront purchases to in-app purchases.   Source: Gartner Report Market Trends: Mobile App Stores, Worldwide, 2012.
  • 99% of the paid-for app store downloads cost less than $3 each. Similar to free apps, lower-priced apps will drive the majority of the downloads. We estimate that apps between $0.99 and $2.99 will account for 87.5% of the paid-for downloads in 2012, up from 86.8% in 2011. That percentage will further increase to 96% by 2016. Source: Gartner Report Market Trends: Mobile App Stores, Worldwide, 2012.
  • Global mobile app store revenue is projected to reach $24.5B in 2013, increasing to $74B in 2017.  Paid-in downloads (69%); in-app purchase (17.3%) and advertising (13.7%) are the three revenue sources in 2013.  In 2017, revenue shifts significantly to paid-for downloads contributing 45.2% of revenue, in-app purchases, 40.9% and advertising, 13.9%.  Source: Gartner Report Market Trends: Mobile App Stores, Worldwide, 2012. 

Aneesh Chopra, Federal CTO and Linda Cureton, NASA CIO, Discuss Cloud Computing

Bottom line: Forward-thinking CTOs and CIOs in governments globally have the potential to drastically reduce process and cost inefficiencies. It remains to be seen if the biggest and costliest impediment of all – which is resistance to change – will be eventually overcome by their efforts.

Read more

%d bloggers like this: