Faced with shorter time-to-market schedules, challenging cost constraints, and ever-increasing customer expectations, manufacturers are accelerating their use of mobility applications. They’re also using them to galvanize production, finance and selling strategies into a unified direction so customers’ expectations can better set and exceeded.
One manufacturer’s CIO summed it up well when he said they hit an inflexion point when their marketing analytics showed over 60% of dealers were looking up product and pricing data on their smartphones and tablets instead of their laptops, a 4X increase in just five months.
The following is a roundup of mobile apps and app store forecasts reflects the urgency all enterprises, including manufacturers, have to get results from their mobility strategies:

- 84% of smartphone shoppers use their phones while in a physical store and 30% use their smartphones to find information instead of asking store employees. according to a study released this month from Google. The study, How Mobile Is Transforming the Shopping Experience in Stores, can be downloaded here. The study also found that 65% prefer mobile sites and search, and 35% prefer apps, not surprising for a study sponsored by Google. There are several interesting findings in the report, including the finding the in-store price comparisons are the most common mobile activity across the eight categories included in the study.


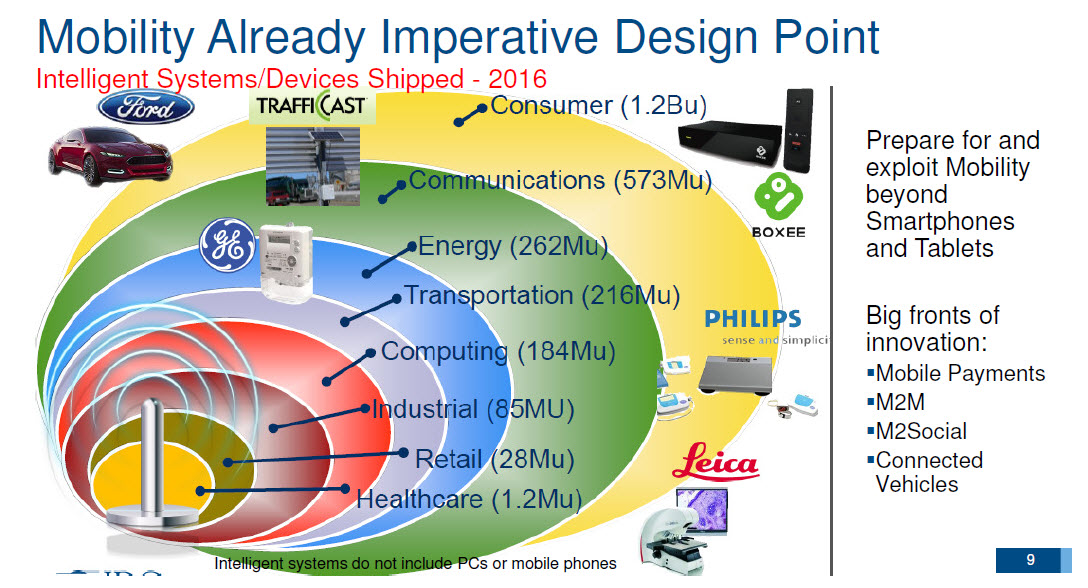
- IDC’s prediction of how mobility will drive intelligent systems adoption, in addition to device management research on smartphone and tablet adoption is covered in the presentation, The Mobility Game Changer; Why The Workplace Will Never Be The Same. The following graphic shows IDC”s forecast of mobile-based intelligent device shipments by market and industry.

Mobile App Store Forecasts
- 90% of global mobile app store downloads in 2013 are forecast to be free, increasing to 93% in 2017. 73.2B free downloads will occur in 2013, increasing to 287.9B by 2017. Paid-for downloads will increase from 8.1B in 2013 to 21.6B in 2017. Source: Gartner Market Trends: Mobile App Stores, Worldwide, 2012.
- In-app purchase will drive 41% of the store revenue in 2016. While the market is moving toward free and low-priced apps, in-app purchase will increase in both the number of downloads and in the contribution to the store revenue. As a result, we see a shift in user spending from upfront purchases to in-app purchases. Source: Gartner Report Market Trends: Mobile App Stores, Worldwide, 2012.
- 99% of the paid-for app store downloads cost less than $3 each. Similar to free apps, lower-priced apps will drive the majority of the downloads. We estimate that apps between $0.99 and $2.99 will account for 87.5% of the paid-for downloads in 2012, up from 86.8% in 2011. That percentage will further increase to 96% by 2016. Source: Gartner Report Market Trends: Mobile App Stores, Worldwide, 2012.
- Global mobile app store revenue is projected to reach $24.5B in 2013, increasing to $74B in 2017. Paid-in downloads (69%); in-app purchase (17.3%) and advertising (13.7%) are the three revenue sources in 2013. In 2017, revenue shifts significantly to paid-for downloads contributing 45.2% of revenue, in-app purchases, 40.9% and advertising, 13.9%. Source: Gartner Report Market Trends: Mobile App Stores, Worldwide, 2012.
 Gartner’s latest Mobile App Store Worldwide Forecast predicts annual downloads will increase 59.38% from 64 billion in 2012 to 102 billion in 2013. Worldwide revenue is forecast to also increase 44.45%, from $18B in 2012 to $26B in 2013.