Microsoft Azure revenue grew 50% year-over-year in fiscal Q2, 2021, contributing to a 26% increase in Server products and cloud services revenue.
According to the latest earnings call, more than 1,000 Microsoft customers now use Azure Arc to simplify hybrid management and run Azure services across on-premises, multi-cloud and at the edge.
Commercial cloud gross margins increased to 71% in the latest quarter, up from 67% a year earlier.
There are now over 60 Azure regions globally, strengthening Microsoft’s competitive global position versus Amazon Web Services.
Microsoft reported $43.08 billion in the second fiscal quarter ended Dec. 31, up from $36.91 billion a year earlier,
These and many other insights are from Microsoft’s Fiscal Year 2021 Second Quarter Earnings Conference Call and related research. Microsoft’s early decision to double down on expanding their cloud platform by accelerating new product and services development and Azure region expansion is paying off. Azure’s revenue growth shows Microsoft is an innovation machine when it comes to the cloud.
Intelligent Cloud delivered the highest operating income of all segments in the 2nd quarter at $6.4 billion or 36% of total consolidated operating income. This quarter, Microsoft’s success with indirect channel sales combined with more enterprise customers accelerating their cloud-first initiatives contributed to Intelligent Cloud leading all segments in operating income. The following is from the Q2, FY21 Earnings Call.
Synergy Research Group’s latest cloud market analysis finds that Amazon and Microsoft are over 50% of the global cloud provider market, with Microsoft reaching 20% worldwide market share for the first time. Q4, 2020 enterprise spending on cloud infrastructure services was just over $37 billion, $4 billion higher than the previous quarter and up 35% from the fourth quarter of 2019. Synergy Research notes that it has taken just nine quarters for the market to double in size.
63% of enterprises are currently running apps on Microsoft Azure, second only to AWS. Azure is narrowing the gap with AWS in both the percentage of enterprises using it and the number of virtual machines (VMs) enterprises are running on it. 6% of enterprises are spending at least $1.2 million annually on Microsoft Azure. Source: Statista and Flexera 2020 State of the Cloud Report, page 50.
2020 total cloud infrastructure services spending grew 33% to $142 billion from $107 billion in 2019, according to Canalys, with Microsoft’s indirect channel business fueling their 20% market share growth. Microsoft’s dominance of indirect selling channels is evident in the level of sales enablement, sales and technical support they provide resellers. Canalys’ Chief Analyst Alastair Edwards says that “organizations are turning to trusted business partners to advise, implement, support and manage their cloud journeys and articulate the real business value of cloud migration.”
19% of enterprises expect to invest significantly more on Microsoft Azure in 2021, leading all other cloud vendors this year. Microsoft Azure leads all vendors when compared to the percentage change in spending this year. It’s noteworthy that 61% of all enterprises interviewed expect to increase their investments in Microsoft Azure this year, second only to Microsoft SaaS software. Source: 2021 Flexera State of Tech Report, January 2021.
Microsoft Azure Stack is the second most-used private cloud platform by enterprises, with 35% of them currently running apps today. Azure Stack also leads all others in experimentation, with one in five enterprises, or 21%, currently in that phase of deployment. 67% of all enterprises interviewed in the 2020 Flexera State of the Cloud Report are either running Azure apps or are considering it.
Microsoft’s centerpiece for their intelligence investment is the Microsoft Intelligent Security Graph, which processes over 630 billion authentications across our cloud services each month. Microsoft relies on the Security Graph to gain insights into normal behavior, including sign-ins and authentications and abnormal behavior, including attempted bypasses to two-factor authentication. Microsoft blocks more than 5 billion distinct malware threats per month, providing a great deal of useful data to analyze endpoints across customers’ networks. Source: Microsoft CISO Workshop 1 – Cybersecurity Briefing.
44.5% of enterprises say Microsoft Azure is their preferred provider for Cloud Business Intelligence (BI). Azure is considered 27% more critical to an enterprises’ Cloud BI requirements and preferences than Amazon Web Services. It’s noteworthy that 96.5% of all enterprises have a preference for Microsoft Azure BI versus its main competitors, including Google Cloud, IBM BlueMix, or Alibaba.
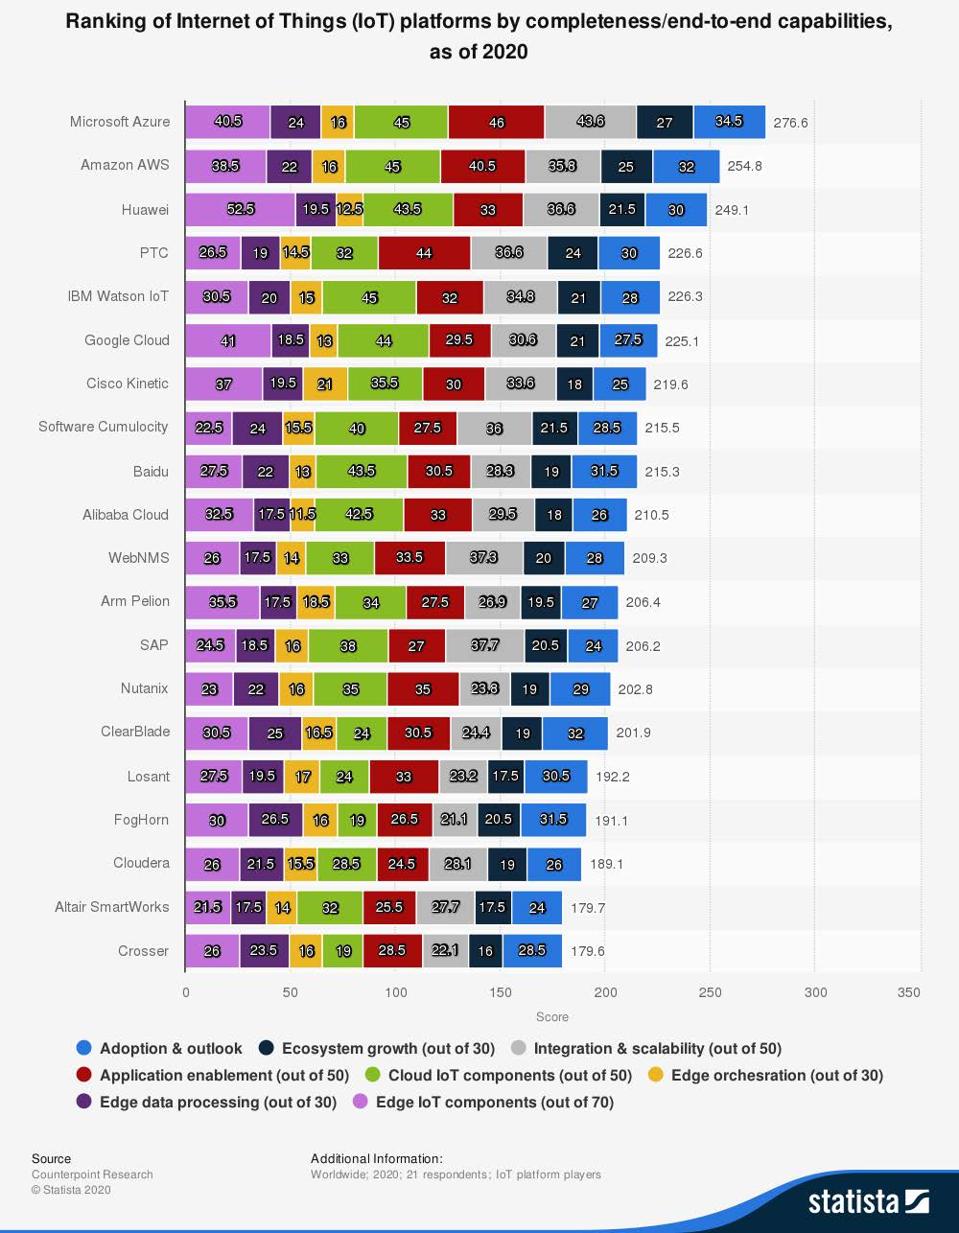
Microsoft Azure is the leading IoT platform worldwide by end-to-end capabilities with a total score of 276 according to Counterpoint Research. According to the methodology Counterpoint used for ranking IoT platforms, Microsoft Azure is considered a global leader in edge data processing, an increasingly important feature of IoT platforms worldwide. The ability to deliver IoT capabilities from the cloud to the edge helped Microsoft’s platform rank high in this category. Source; Statista and CounterPointResearch.com.
Microsoft Azure is the foundation for a Digital Supply Chain Platform that integrates supply chain partner, corporate, data & advanced analytics platforms and supply chain core transaction systems. The ongoing pandemic is putting continued pressure on supply chains. Most manufacturing executives say that employee safety, data security, remote worker access, supply chain visibility and insights visibility are high priorities. In response to these market needs, Microsoft Supply Chain (MSC) was created on the Azure platform. The diagram below explains how Azure is integral to the Digital Supply Chain platform.
Kirill Tatarinov’s keynote this morning at Microsoft’s Convergence 2013 marks a subtle, yet very significant shift in how this technology leader is marketing itself to partners and the outside world. They are humanizing their marketing, messaging and products.
Gone is the Spock-like precision of presentations packed with roadmaps, mind-numbing metrics and intricate feature analysis. The Nick Brophy Band made the keynote complete by delivering excellent sets.
Microsoft is learning that telling a good story trumps terabytes of metrics. They delivered a strong keynote today starting out showing how attendees reached out to the local community and helped Habitat for Humanity. Kirill then based the majority of his keynote on four customer success stories taken from the Microsoft Customer Excellence Award winners. Chobani, Shock Doctor, Revlon and Weight Watchers shared how they were able to better connect with customers and run more efficient businesses using Microsoft Dynamics.
The only aspect of these award winner’s stories that fell short was how the complexity of back office system integration was glossed over. No mention of third party or legacy system integration was made, which could have shown how far Microsoft and its partners have progressed on this point, especially with the help of integration partners like Scribe Software.
Microsoft’s Cloud-First Strategy Playing Well With Partners
For Microsoft to succeed with Windows Dynamics and Azure, they are going to need each partner and reseller to believe in the vision of a cloud-first strategy, then translate their unique expertise into sales. That’s going to be a challenge that Microsoft will have to deal with daily as it looks to further strengthen its partner and reseller base. The recent Azure outage caused by an expired SSL certificate is on the minds of many partners and resellers here too. Microsoft is promoting their Windows Azure Service Dashboard heavily here as a result.
Despite that recent outage, Microsoft’s ecosystem on Dynamics is flourishing , as is evidenced by the attendance and participation in this show. The cloud-first strategy has infused a sense of hope and anticipation in many partners and resellers. Walking the floor yesterday and today, nearly eight of every ten partners offered up how they are planning on the cloud without being asked about it.
Microsoft 2013 Roadmap Embracing the Cloud, Devices and Services
Kirill Tatarinov’s keynote underscored how committed Microsoft is to becoming as cloud, devices and services company. He cited the statistic that there are more devices connected to the Internet today than there are human beings on the planet.
Through several examples he also showed how Microsoft is moving full speed into being a devices and services business. Microsoft Windows Azure is the foundational component to this strategy. While Kirill did not specifically say that, it is clear from an architectural standpoint Windows Azure will be the foundational element of their devices and services strategy. Microsoft is already competing with market leader Amazon Web Services, Google, Rackspace and many others. For more information on the competitive landscape of this market, please see my previous post, Demystifying Cloud Vendors.
From a roadmap perspective this will also force Microsoft to support many more mobile operating systems and environments than they ever have before. For their device and services strategy to succeed for example, they will have to support Google Android and Apple iOS device interfaces capable of integrating with SQL Server, at a minimum.
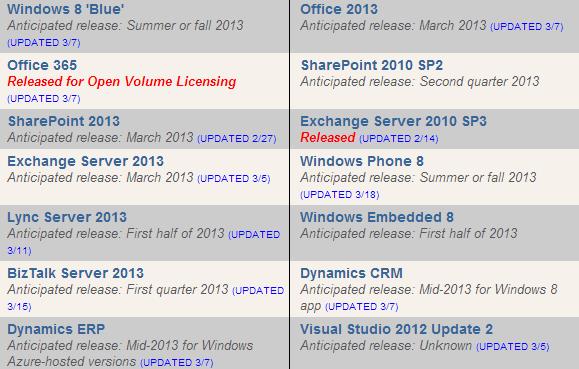
The following table showing recently announced updates to the 2013 Microsoft Product Roadmap first appeared on the Redmond Channel Partner website on march 18th.
Microsoft reports that Office365 will go to an accelerated release cycle, further capitalizing on the nature of a cloud-based architecture. Resellers at this conference like the Office 365 Open licensing program because it allows them to direct-bill customers for use of the suite, in addition to paying for the bundle of their services. Windows Azure-hosted versions of Dynamics NAV and Dynamics GP will arrive in mid-2013 according to the article as well.
For the cloud, device and services strategy to succeed Microsoft must also succeed in convincing enterprise accounts to migrate their applications to Windows Azure. This is one of the most critical areas for the future of their cloud strategy in the enterprise, so expect to see customer stories and ongoing messaging on this point.
Bottom line: Microsoft is transitioning to a more humanized approach to marketing while embracing a cloud, device and services strategy. It will be the partner ecosystem that transforms that vision into a profitable reality.
Updated 12 November 2026. This post first appeared on 17 November 2010 as a short note on Google App Engine and the Google Labs cloud APIs. It is the most visited page on this site this month. So the text below replaces the original with a Google Cloud technologies overview for 2026 and a look at 2027. The 2010 version is summarized in the first section for anyone who arrived looking for it.
Google Cloud by the numbers in 2026. Quarterly revenue and contracted backlog for the five quarters through Q3 2026, what each piece of the 2010 stack is called today, and the four figures that define the business at the end of 2026. Click any chart to open it full size. Sources linked below, analysis by softwarestrategiesblog.com.
Google Cloud reported $30.7 billion of revenue for the third quarter of 2026, up 103% from $15.2 billion a year earlier. Operating income reached $11.1 billion, a 36.2% margin, compared to $3.6 billion and 23.7% a year earlier. Contracted backlog stood at $561 billion at the end of September, up from $155 billion twelve months before. Alphabet expects to recognize just over 55% of it as revenue within 24 months. The business this post described in 2010 did not disclose revenue at all. In 2026 it is the fastest growing of the three largest clouds and Alphabet’s second largest source of operating income.
This Google Cloud technologies overview covers four things. It starts with what the 2010 stack looked like and what each piece is called today. It then works through the financial record from the first disclosure in 2020 to the Q3 2026 results. The third section compares Google Cloud with AWS and Microsoft Azure using Synergy Research Group’s Q3 2026 market data. After that comes the platform announced at Google Cloud Next in April 2026. The final section sets out what the backlog, capex guidance and competitor commentary already say about 2027.
What the 2010 Google cloud stack became
In November 2010 Google’s cloud effort was a developer evangelism program. The original post pointed readers to the Google Labs catalog and to a slide deck by Google developer advocate Chris Schalk. The deck covered Google Storage for Developers, the Prediction API and BigQuery, all three of them in preview. App Engine, launched in 2008, was the production product at the time. The post contrasted Google’s incremental approach with how often Amazon Web Services changed its platform, pricing and services. Google did not report cloud revenue then, since it had no cloud segment to report.
Almost every element of that stack still exists under a different name. Google Storage for Developers became Cloud Storage. BigQuery left preview in 2011 and now anchors what Google calls the Agentic Data Cloud. The Prediction API was shut down in 2018. Its role passed to Cloud Machine Learning Engine, then to Vertex AI in 2021, and in April 2026 to the Gemini Enterprise Agent Platform. Google Labs closed in 2011, and Google Cloud Next is where new services launch instead. App Engine, in fact, remains available inside Google Cloud. Google itself became a subsidiary of Alphabet in 2015. Alphabet first reported Google Cloud as a segment in February 2020, disclosing $8.9 billion of 2019 revenue. The 2018 figure was $5.8 billion and the 2017 figure $4.1 billion.
Two businesses that did not exist in 2010
The first is security. Google Cloud bought Mandiant in September 2022 for $5.4 billion. It then closed its $32 billion acquisition of Wiz on 11 March 2026, the largest purchase in Alphabet’s history. The second is custom silicon sold to customers rather than used internally. The Tensor Processing Unit did not reach outside developers until 2018. In 2026 Alphabet counts more than 100 significant TPU customers and sells TPU systems for installation in customers’ own data centers.
Google Cloud revenue went from $4 billion a year to $30.7 billion a quarter
Google Cloud segment revenue by year, from Alphabet’s 10-K and 10-Q filings. The segment lost money every year through 2022, earned $1.7 billion in 2023 and $26.5 billion in the first nine months of 2026. Sources linked below, analysis by softwarestrategiesblog.com.
Google Cloud revenue has grown every year since Alphabet began disclosing it. Segment revenue was $13.1 billion in 2020 and $19.2 billion in 2021. It then reached $26.3 billion in 2022, $33.1 billion in 2023 and $43.2 billion in 2024. Alphabet’s 2025 Form 10-K puts 2025 revenue at $58.7 billion. The first nine months of 2026 added $75.5 billion, more than the whole of 2025. At the Q3 2026 rate the segment is on a $123 billion annual run rate. That is roughly fourteen times the $8.9 billion it reported for 2019, before the segment turned a profit.
Profitability arrived later than scale. The segment reported operating losses in every year through 2022. It then earned $1.7 billion in 2023, $6.1 billion in 2024 and $13.9 billion in 2025. The first nine months of 2026 produced $26.5 billion, almost double the full year before, according to Alphabet’s Q3 2026 Form 10-Q. Operating margin moved from 5.2% in 2023 to 14.1% in 2024, 23.7% in 2025 and 36.2% in the latest quarter.
Growth accelerated for five straight quarters
The acceleration is recent and steep. Google Cloud grew 34% in Q3 2025 and 48% in Q4 2025. It grew 63% in Q1 2026, 82% in Q2 2026 and 103% in Q3 2026. Quarterly revenue went from $15.2 billion to $30.7 billion over those five quarters. Alphabet attributes the growth to Google Cloud Platform, and within it to AI infrastructure and enterprise AI solutions. Core GCP products grew as well, though more slowly. Eighteen Google Cloud product lines each generate more than $1 billion a year. About 90% of the Fortune 100 use Gemini Enterprise, according to the Q3 2026 earnings call.
Backlog grew faster than revenue. Remaining performance obligations are the contracted revenue not yet recognized. They went from $155 billion in Q3 2025 to $240 billion in Q4 2025 and $462 billion in Q1 2026. They then reached $514 billion in Q2 2026 and $561 billion in Q3 2026. At the Q2 call Alphabet said just over 50% of backlog would convert to revenue within 24 months. By the Q3 10-Q that figure was just over 55%. So about $309 billion of contracted revenue sits inside the next two years before any new signings.
Google Cloud gains share while AWS loses it
The three largest cloud providers in Q3 2026. AWS remains the largest, Google Cloud grows more than twice as fast as either rival, and Synergy Research has Google Cloud gaining three points of share in a year while AWS loses three. Sources linked below, analysis by softwarestrategiesblog.com.
Synergy Research Group puts worldwide cloud infrastructure services revenue at $167.7 billion for Q3 2026, up 55% from a year earlier. It was the twelfth consecutive quarter in which the growth rate increased. Trailing twelve-month revenue, as a result, reached $558 billion. Within that market Synergy has Amazon at 26% share, down from 29% a year earlier. Microsoft holds 19% against 20%, and Google 16% against 13%. Oracle, Alibaba, SpaceX and xAI, CoreWeave, Salesforce and Anthropic each hold between 2% and 4%.
The company results line up with the shares. AWS reported $46.0 billion of Q3 2026 revenue, up 39%. Its operating income was $17.8 billion, so its run rate is $184 billion at a 38.7% margin. Microsoft disclosed Azure revenue in dollars for the first time at $33.2 billion, up 48%, a $133 billion run rate. Google Cloud’s $30.7 billion, up 103%, sits $2.5 billion behind Azure and $15.3 billion behind AWS for the quarter. A year earlier the gaps were larger on every measure. Google Cloud was growing 34% then, while AWS grew 20% and Azure 40%.
Google Cloud’s margin now sits between its two rivals. AWS earned a 38.7% operating margin in Q3 2026 while Google Cloud earned 36.2%. Microsoft, by comparison, does not disclose Azure operating income. For comparison, Synergy’s Q3 2022 shares were 34% for Amazon, 21% for Microsoft and 11% for Google. Google has gained five points of share in four years while Amazon has lost eight.
The 2026 platform is built around agents and TPUs
Google Cloud Next 2026 ran from 22 to 24 April in Las Vegas. It drew more than 32,000 attendees and produced 260 announcements. The center of them was the Gemini Enterprise Agent Platform, the renamed and extended Vertex AI. It adds Agent Studio for building agents and an Agent Registry for cataloging them. Agent Identity gives each agent its own credentials, Agent Gateway enforces policy on every call, and Agent Observability traces what agents do. The point of the five components is that an enterprise can build, authorize, route and audit agents in one place rather than stitching controls together from separate products.
Infrastructure announcements followed the same theme. TPU 8t is the eighth generation training chip. It scales to 9,600 chips and 2 petabytes of high bandwidth memory in a single superpod. Google rates it at three times the compute of Ironwood, twice the performance per watt and 2.7 times the training performance per dollar. TPU 8i is the inference part, with 1,152 chips per pod and an 80% improvement in inference performance per dollar compared to the prior generation. Google also described Virgo, a custom network for connecting TPU supercomputers into larger clusters. The Agentic Data Cloud rounds it out. Its Cross-Cloud Lakehouse is standardized on Apache Iceberg, so BigQuery can query data where it sits, including data left in AWS.
The money behind the platform is unusually visible. Alphabet spent $51.4 billion on capital expenditure in Q3 2026. It held its 2026 guidance at $195 billion to $205 billion. Total Alphabet revenue reached $127.6 billion in the quarter, up 25%, with $40.6 billion of operating income. The Gemini app also passed one billion monthly users during the quarter.
Security is Google Cloud’s $37 billion acquisition story
Google Cloud entered security by acquisition. Mandiant, bought for $5.4 billion in 2022, brought incident response and threat intelligence. Wiz was announced in March 2025 for $32 billion and closed on 11 March 2026 for $29.5 billion after adjustments. It brought a multicloud security platform that Google has kept as a separate brand since the deal closed. Wiz still works across AWS, Azure and Oracle as well as Google Cloud. The purchase added $22.7 billion of goodwill to the Google Cloud segment. That is what Alphabet paid for the customer base, the engineers and the market position rather than the code.
The combined products now ship under Google AI Threat Defense. It pairs Gemini models with Wiz, Mandiant intelligence and the CodeMender code repair agent. Wiz, for its part, introduced Red, Blue and Green agents for offensive testing, defensive response and remediation. Google’s security blog describes the goal as an agentic security operations center. In it, agents triage alerts, investigate and recommend responses while analysts approve the steps. For readers of this site, that matters for one reason. The controls Google ships for its own agents, Agent Identity and Agent Gateway in particular, are the same controls enterprises need for agents built on any platform.
What 2027 already looks like
Three numbers already shape 2027, starting with the backlog. Just over 55% of $561 billion converts within 24 months, so roughly $309 billion of revenue is contracted before Google Cloud sells anything new. Spread evenly, that alone is about $155 billion a year, above the current $123 billion run rate. The second is capital spending, which is still rising. Alphabet told investors on the Q3 2026 call to expect capex to increase significantly in 2027. The 2026 range is $195 billion to $205 billion, and the Cloud segment carries much of the depreciation. Operating margin rose from 23.7% to 36.2% in a year while that spending ramped. The question for 2027 is whether margin keeps rising as the depreciation catches up.
The third is the competition’s own guidance. Amazon CEO Andy Jassy told analysts he expects AWS to grow more than 40% in 2027 and 2028. To keep gaining share, Google Cloud has to grow faster than that from a base now two thirds the size of AWS. Synergy’s data has the entire market compounding at over 50%. The test of 2027 is whether the three leaders can all grow above 40% at the same time. That has never happened at this scale.
Two other threads run into 2027. TPU systems are now sold into customers’ own data centers, with Oracle and Crux AI named as early buyers. That turns Google’s silicon into a product line rather than an internal advantage. Wiz plus Mandiant gives Google Cloud a security business that competes with CrowdStrike and Palo Alto Networks as much as with AWS. Neither chips for sale nor security acquisitions were part of the plan when App Engine was the product. The 2010 version of this post did not see either one coming.
Key takeaways
Google Cloud doubled in a year. Q3 2026 revenue of $30.7 billion was up 103% from $15.2 billion. Growth also accelerated in each of the last five quarters.
The backlog is the forecast. Contracted backlog reached $561 billion, with just over 55% converting within 24 months. That puts about $309 billion of revenue under contract for the next two years.
Margins moved from 5% to 36% in three years. Operating margin went from 5.2% in 2023 to 36.2% in Q3 2026, on $11.1 billion of quarterly operating income.
Google Cloud is the share gainer. Synergy Research puts it at 16% of a $168 billion quarterly market, up from 13%. AWS, in contrast, fell from 29% to 26%.
The 2010 stack survived under new names. Google Storage is Cloud Storage and BigQuery anchors the Agentic Data Cloud. The Prediction API’s role, in turn, now belongs to the Gemini Enterprise Agent Platform.
Security is a $37 billion acquisition story. Mandiant at $5.4 billion in 2022 and Wiz at $32 billion in 2026 gave Google Cloud a security business that sells across every major cloud.
2027 is a capex and margin test. Alphabet expects capex to rise significantly from the 2026 range of $195 billion to $205 billion. AWS guides to more than 40% growth, so share gains require Google Cloud to grow faster than that.
The following is an excellent presentation that explains the core concepts of Microsoft's Cloud Computing strategy. Included is an overview of the Microsoft Windows Azure strategy with explanations and pricing of each component.