Skip to content

Posts from the ‘Analyst Research: Forrester & IDC’ Category

McKinsey’s 2016 Analytics Study Defines The Future Of Machine Learning

  • U.S. retailer supply chain operations who have adopted data and analytics have seen up to a 19% increase in operating margin over the last five years.
  • Design-to-value, supply chain management and after-sales support are three areas where analytics are making a financial contribution in manufacturing.
  • 40% of all the potential value associated with the Internet of Things requires interoperability between IoT systems.

These and many other insights are from the McKinsey Global Institute’s study The Age of Analytics: Competing In A Data-Driven World published in collaboration with McKinsey Analytics this month. You can get a copy of the Executive Summary here (28 pp., free, no opt-in, PDF) and the full report (136 pp., free, no opt-in, PDF) here. Five years ago the McKinsey Global Institute (MGI) released Big Data: The Next Frontier For Innovation, Competition, and Productivity (156 pp., free no opt-in, PDF), and in the years since McKinsey sees data science adoption and value accelerate, specifically in the areas of machine learning and deep learning. The study underscores how critical integration is for gaining greater value from data and analytics.

Key takeaways from the study include the following:McKinsey Analytics

  • Location-based services and U.S. retail are showing the greatest progress capturing value from data and analytics. Location-based services are capturing up to 60% of data and analytics value today predicted by McKinsey in their 2011 report. McKinsey predicts there are growing opportunities for businesses to use geospatial data to track assets, teams, and customers across dispersed locations to generate new insights and improve efficiency. U.S. Retail is capturing up to 40%, and Manufacturing, 30%.  The following graphic compares the potential impact as predicted in McKinsey’s 2011 study with the value captured by segment today, including a definition of major barriers to adoption.

uneven-progress

  • Machine learning’s greatest potential across industries includes improving forecasting and predictive analytics. McKinsey analyzed the 120 use cases their research found as most significant in machine learning and then weighted them based on respondents’ mention of each. The result is a heat map of machine learning’s greatest potential impact across industries and use case types.  Please see the report for detailed scorecards of each industry’s use case ranked by impact and data richness.

machine-learning-impact

  • Machine learning’s potential to deliver real-time optimization across industries is just starting to evolve and will quickly accelerate in the next three years. McKinsey analyzed the data richness associated with each of the 300 machine learning use cases, defining this attribute as a combination of data volume and variety. Please see page 105 of the study for a thorough explanation of McKinsey’s definition of data volume and variety used in the context of this study The result of evaluating machine learning’s data richness by industry is shown in the following heat map:

rich-data-is-an-enabler

  • Enabling autonomous vehicles and personalizing advertising are two of the highest opportunity use cases for machine learning today. Additional use cases with high potential include optimizing pricing, routing, and scheduling based on real-time data in travel and logistics; predicting personalized health outcomes, and optimizing merchandising strategy in retail. McKinsey identified 120 potential use cases of machine learning in 12 industries and surveyed more than 600 industry experts on their potential impact. They found an extraordinary breadth of potential applications for machine learning.  Each of the use cases was identified as being one of the top three in an industry by at least one expert in that industry. McKinsey plotted the top 120 use cases below, with the y-axis shows the volume of available data (encompassing its breadth and frequency), while the x-axis shows the potential impact, based on surveys of more than 600 industry experts. The size of the bubble reflects the diversity of the available data sources.

machine-learning

  • Designing an appropriate organizational structure to support data and analytics activities (45%), Ensuring senior management involvement (42%), and designing effective data architecture and technology infrastructure (36%) are the three most significant challenges to attaining data and analytics objectives. McKinsey found that the barriers break into the three categories: strategy, leadership, and talent; organizational structure and processes; and technology infrastructure. Approximately half of executives across geographies and industries reported greater difficulty recruiting analytical talent than any other kind of talent. 40% say retention is also an issue.

barriers-to-analytics-and-machine-learning-adoption

  • U.S. retailer supply chain operations who have adopted data and analytics have seen up to a 19% increase in operating margin over the last five years. Using data and analytics to improve merchandising including pricing, assortment, and placement optimization is leading to an additional 16% in operating margin improvement. The following table illustrates data and analytics’ contribution to U.S. retail operations by area.

us-retail-data-sheet

  • Design-to-value, supply chain management and after-sales support are three areas where analytics are making a financial contribution in manufacturing. McKinsey estimates that analytics have increased manufacturer’s gross margins by as much as 40% when used in design-to-value workflows and projects. Up to 15% of after-sales costs have been reduced through the use of analytics that includes product sensor data analysis for after-sales service. There are several interesting companies to watch in this area, with two of the most innovative being Sight Machine and enosiX, with the latter enabling real-time integration between SAP and Salesforce systems. The following graphic illustrates the estimated impact of analytics on manufacturing financial performance by area.

manufacturing

IDC’s Top Ten Technology Predictions For 2014: Spending On Cloud Computing Will Exceed $100B

Planning-for-Cloud-Computing-2014-Final-300x2242-300x225International Data Corporation recently presented their top ten technology predictions for 2014.   Frank Gens, Senior Vice President and Chief Analyst at IDC hosted a webinar to present the research firm’s predictions for 2014 including the research firm’s latest cloud computing market forecast.  You can see a replay of the webinar and get the predictions documents at IDC Predictions 2014.  They are briefly summarized below:

  • Emerging markets will return to double-digit growth of 10%, driving nearly $740B or 35% of worldwide IT revenues and, for the first time, more than 60% of worldwide IT spending growth.  IDC also predicted that in 2014 the number of smart connected devices shipped in emerging markets will almost double that shipped in developed markets. In addition, IDC predicts that over the next seven years emerging markets cloud spending will grow seven-fold versus three-fold in developed markets.  IDC is predicting IT spending in Western Europe will be marginally up, with U.S. and Japan spending marginally down.
  • 3rd-platform-253x300Worldwide IT spending will grow 5% year over year to $2.1 trillion in 2014. Spending will be driven by 3rd Platform technologies, which will grow 15% year over year and capture 89% of IT spending growth.  Smartphones and tablets will lead 2014 growth, accounting for over 60% of total IT growth.  Excluding mobile devices, IT growth will only by a modest 2.4%.  The graphic shown to the right was shared during the webinar today, explaining the 3rd platform and its contribution to market growth.
  • Within the 3rd Platform, value will start to migrate “up the stack”, from infrastructure as a service (IaaS) to platform as a service (PaaS) and from generic PaaS to data-optimized PaaS. The latter will be most evident as Amazon Web Services rolls out an avalanche of platform-as-a-service offerings for developers and higher value services for businesses. This will force incumbent IT suppliers – the companies that won market leadership in the 2nd Platform era – to urgently reconfigure themselves to fight for position in the 3rd Platform marketplace.
  • The mobile device onslaught will continue in 2014 with sales of tablets growing by 18% and smartphones by 12%. The Android community, led by Samsung, will maintain its volume advantage over Apple, while Apple will hold onto its value edge with higher average selling prices and an established ecosystem of apps. But Google Play (Android) app downloads and revenues are making dramatic gains and the “app ecosystem value gap” will be significantly narrowed in 2014. And the clock will be ticking louder for Microsoft, which needs to quickly double mobile developer interest in Windows.  Frank Gens presented the following graphic to support this prediction:

idc

  • Cloud spending, including cloud services and the technology to enable these services, will surge by 25% in 2014, reaching over $100B.   IDC explained the $100B figure includes software, services and cloud infrastructure.  IDC also expects to see a dramatic increase in the number of datacenters as cloud players race to achieve global scale. This will be accompanied by a similar expansion in the variety of workload-specialized cloud infrastructure services, leading to new forms of differentiation among cloud service providers. Finally, a pitched battle will be joined for the developers that can create the cloud-based applications and solutions that will fuel the market’s growth.  IDC predicts that by 2017, 80%+ of new cloud apps will be hosted on six PaaS platforms.
  • Spending on big data technologies and services will grow by 30% in 2014, surpassing $14 billion as demand for big data analytics skills continues to outstrip supply. Here the race will be on to develop “data-optimized cloud platforms”, capable of leveraging high volumes of data and/or real-time data streams. Value-added content providers and data brokers will proliferate as enterprises (and developers) look for interesting data sources as well as applications that help them to understand their customers, products, and the markets in which they exist.  IDC is also predicting that big data analytics services 2014 spending will exceed $4.5B, growing 21% over 2013.
  • Social technologies will become increasingly integrated into existing enterprise applications over the next 12-18 months. In addition to being a strategic component in virtually all customer engagement and marketing strategies, data from social applications will feed the product and service development process. IDC expects enterprise social networks will become increasingly available as standard offerings from cloud services providers. This will enable enterprises to further embed social into the workflow, rather than having a separate “social layer.”  IDC also predicts that by 2017, 80% of Fortune 500 companies will have an active customer community, up from 30% today.  By 2016, 60% of the Fortune 500 will deploy social-enabled innovation management solutions.
  • Datacenters represent the physical foundation underneath the cloud, and are thus a crucial component of the 3rd Platform. As cloud-dedicated datacenters grow in number and importance, the market for server, storage, and networking components will increasingly be driven by cloud service providers, who have traditionally favored highly componentized and commoditized designs. The incumbent IT hardware vendors, who have struggled to sell into this market, will be forced to adopt a “cloud-first” strategy, designing new innovations for initial release and widespread adoption in cloud service provider datacenters.
  • The 3rd Platform will deliver the next generation of competitive advantage apps and services that will significantly disrupt market leaders in virtually every industry. A key to competing in these disrupted and reinvented industries will be to create industry-focused innovation platforms (like GE’s Predix) that attract and enable large communities of innovators – dozens to hundreds will emerge in the next several years. IDC predicts that most of these industry platform players will not reinvent the cloud underpinnings they need, but will build on top Amazon, Microsoft, IBM, Salesforce, and others’ platforms. In 2014, it will be critically important for these IT leaders to find these emerging industry platform players and win their business.
  • The 3rd Platform will continue to expand beyond smartphones, tablets, and PCs in 2014 to the Internet of Things (IoT). With IoT momentum building in 2014, IDC expects to see new industry partnerships to emerge as traditional IT vendors accelerate their partnerships with global telecom service providers and semiconductor vendors to create integrated offerings in the consumer electronics and connected device spaces. This kind of collaboration and coordination will be necessary to reach the 30 billion autonomously connected end points and $8.9 trillion in revenues that IDC believes the IoT will generate by 2020.

Source: IDC Predicts 2014 Will Be a Year of Escalation, Consolidation, and Innovation as the Transition to IT’s “3rd Platform” Accelerates 

Roundup Of Mobile Apps & App Store Forecasts, 2013

mobile app developmentFaced with shorter time-to-market schedules, challenging cost constraints, and ever-increasing customer expectations, manufacturers are accelerating their use of mobility applications. They’re also using them to galvanize production, finance and selling strategies into a unified direction so customers’ expectations can better set and exceeded.

One manufacturer’s CIO summed it up well when he said they hit an inflexion point when their marketing analytics showed over 60% of dealers were looking up product and pricing data on their smartphones and tablets instead of their laptops, a 4X increase in just five months.

The following is a roundup of mobile apps and app store forecasts reflects the urgency all enterprises, including manufacturers, have to get results from their mobility strategies:

mobile application usage

  • 84% of smartphone shoppers use their phones while in a physical store and 30% use their smartphones to find information instead of asking store employees. according to a study released this month from Google.  The study, How Mobile Is Transforming the Shopping Experience in Stores, can be downloaded here. The study also found that 65% prefer mobile sites and search, and 35% prefer apps, not surprising for a study sponsored by Google.  There are several interesting findings in the report, including the finding the in-store price comparisons are the most common mobile activity across the eight categories included in the study.

In store price comparisons

market-shares1

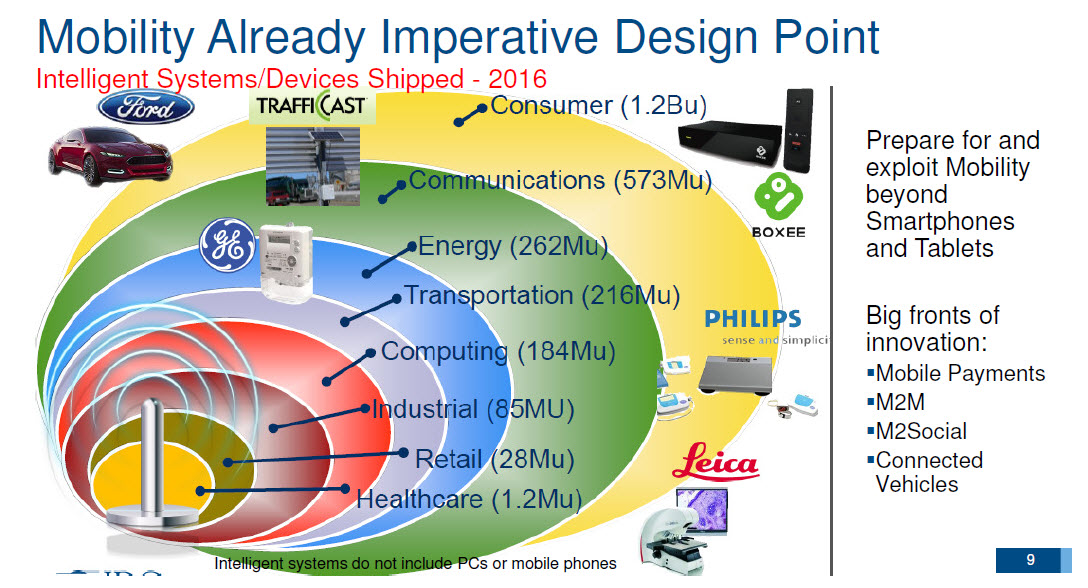
  • IDC’s prediction of how mobility will drive intelligent systems adoption, in addition to device management research on smartphone and tablet adoption is covered in the presentation, The Mobility Game Changer; Why The Workplace Will Never Be The Same. The following graphic shows IDC”s forecast of mobile-based intelligent device shipments by market and industry.

mobility analysis

Mobile App Store Forecasts

  •  90% of global mobile app store downloads in 2013 are forecast to be free, increasing to 93% in 2017.  73.2B free downloads will occur in 2013, increasing to 287.9B by 2017.  Paid-for downloads will increase from 8.1B in 2013 to 21.6B in 2017.  Source: Gartner Market Trends: Mobile App Stores, Worldwide, 2012.
  • In-app purchase will drive 41% of the store revenue in 2016. While the market is moving toward free and low-priced apps, in-app purchase will increase in both the number of downloads and in the contribution to the store revenue. As a result, we see a shift in user spending from upfront purchases to in-app purchases.   Source: Gartner Report Market Trends: Mobile App Stores, Worldwide, 2012.
  • 99% of the paid-for app store downloads cost less than $3 each. Similar to free apps, lower-priced apps will drive the majority of the downloads. We estimate that apps between $0.99 and $2.99 will account for 87.5% of the paid-for downloads in 2012, up from 86.8% in 2011. That percentage will further increase to 96% by 2016. Source: Gartner Report Market Trends: Mobile App Stores, Worldwide, 2012.
  • Global mobile app store revenue is projected to reach $24.5B in 2013, increasing to $74B in 2017.  Paid-in downloads (69%); in-app purchase (17.3%) and advertising (13.7%) are the three revenue sources in 2013.  In 2017, revenue shifts significantly to paid-for downloads contributing 45.2% of revenue, in-app purchases, 40.9% and advertising, 13.9%.  Source: Gartner Report Market Trends: Mobile App Stores, Worldwide, 2012. 

Roundup of Cloud Computing & Enterprise Software Market Estimates and Forecasts, 2013

157989221When the CEO of a rust-belt manufacturer speaks of cloud computing as critical to his company’s business strategies for competing globally, it’s clear a fundamental shift is underway.

Nearly every manufacturing company I’ve spoken with in the last ninety days has a mobility roadmap and is also challenged to integrate existing ERP, pricing and fulfillment systems into next-generation selling platforms.

One of the most driven CEOs I’ve met in manufacturing implemented a cloud-based channel management, pricing, quoting and CRM system to manage direct sales and a large distributor network across several countries.  Manufacturers are bringing an entirely new level of pragmatism to cloud computing, quickly deflating its hype by pushing for results on the shop floor.

There’s also been an entirely new series of enterprise software and cloud computing forecasts and market estimates published.  I’ve summarized the key take-aways below:

Figure 1 enteprise spending

Figure 2

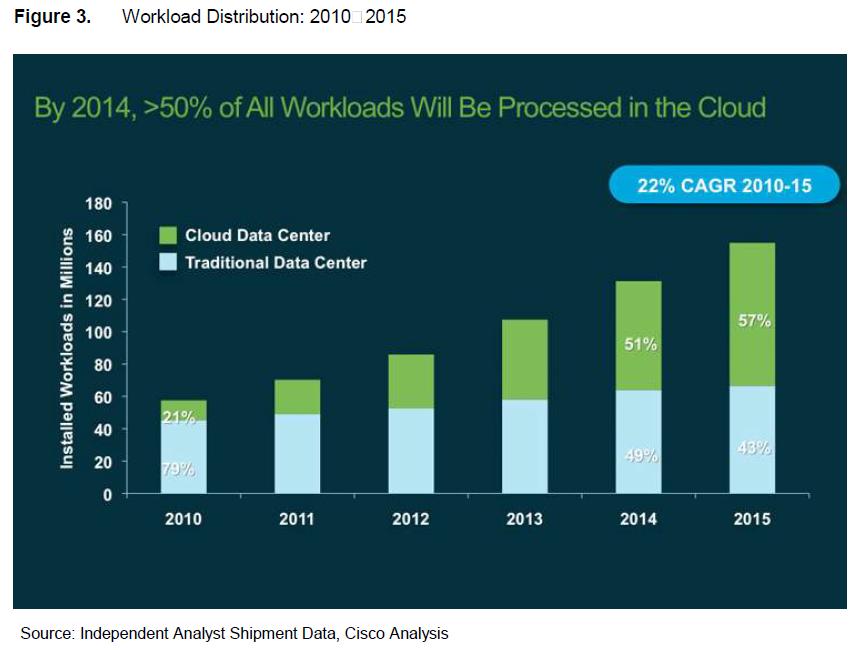
figure 3 cloud computing

 public cloud forecast

Forrester Wave

  • IDC is predicting Cloud Services and enablement spending will hit $60 billion, growing at 26% through the year and that over 80% of new apps will be distributed and deployed on cloud platforms.  Their predictions also are saying that 2.5% of legacy packaged enterprise apps will start migrating to clouds.  Source: Top 10 Predictions, IDC Predictions 2012: Competing for 2020 by Frank Gens. You can download a copy of the IDC Predictions here: http://cdn.idc.com/research/Predictions12/Main/downloads/IDCTOP10Predictions2012.pdf

How Google is Driving Mobile Video Market Growth

Google’s top advertising customers are pushing for convergence of mobile and video quickly, which is turning into a strong catalyst of growth of the global mobile video market.  With their largest advertising customers wanting greater flexibility in bringing video to mobile devices, Google will make significant strides this year to make that happen.

During their latest earnings call, Google execs said that Android, Chrome and YouTube are the highest priority areas of their business. I’ve been following the last year of earnings calls closely, and it’s clear that Google’s largest advertising customers are pushing the company to bring video to mobile at a level of performance and usability not accomplished yet.  The Q2, 2012 earnings call transcript makes this point clear which can be accessed here Google’s Management Discusses Q2 2012 Results – Earnings Call Transcript.

 Mobile and Video: Transforming Convergence Into Cash

Over the last year, Google executives have mentioned the growth of YouTube and its quick evolution from a content management system to a profitable advertising platform.   During the Q1, 2012 earnings call held on April 12, 2012 the following points were made:

  • Google reported they had over 800 million monthly users uploading over an hour of video per second
  • U.K. mobile operator O2 used YouTube as the foundation of a brand launch that year with support for 100 new original channels completed and launched
  • Global product launch plans from GM, Toyota and Unilever and several other large advertising accounts are also underway

During the Q2, 2012 earnings call, Nikesh Arora, Senior Vice President and Chief Business Officer started his comments regarding the YouTube business with the statement “I think in 2007 it was when newspapers frequently said YouTube is groping for an effective business model. I think we can declare we found our model.” Immediately after making this statement, Mr. Arora mentioned that yearly account signups have doubled year-over-year and users are uploading over 72 hours of video every minute.  He also mentioned that  “thousands of partners are making six figures and we’re proud to work with major record labels in Hollywood studios on this platform.”

The call continued with the points made of Danish advertisers shifting their television advertising dollars to YouTube and other Google branding solutions.  Additional companies mentioned on the call using YouTube-based advertising include Denon, Shire, and Intel.  Clearly these companies have major product introductions coming up and see mobile video as perfect for reaching more potential customers than ever before.

Google’s Challenge: Keep Content Quality and User Experience Constantly Improving

If Google is going to attain the full revenue potential of YouTube as an advertising platform, they’ll need to focus on the following factors:

  • Create Application Programmer Interfaces (APIs) and easy-to-use programming tools for quickly creating mobile-optimized sites.  As Gartner studies have shown, video on telephones is most often used as a time-filler, with a median length of 2 minutes, 46 seconds.
  • YouTube will need to support more optimized mobile-based video browsers that can support contextual search.  This will be a core requirement for the enterprise, specifically in the areas of mobile customer care, mobile commerce and mobile health.
  • More extensive analytics in YouTube than are available today, specifically tying into to major marketing strategies including product introductions.  It is becoming common knowledge that videos improve viewer engagement and prospects attribute a more positive shopping experience when they are used.  Luxury brands are investing heavily in this technology including BMW, Burberry, Channel, Louis Vuitton and many others.
  • A Google/Ipsos OTX MediaCT smartphone users study completed in April, 2011 shows that 77% of smartphone users said that their most visited site was a mobile search engine.

Mobile Video: The Market YouTube Built

The size of the worldwide mobile video market was comprised of 429 million mobile video users in 2011, projected to grow exponentially to 2.4 billion users by 2016.  Smartphones and tablet sales will contribute 440 million new mobile video users during the forecast period.  These market estimates are from the recently published Gartner report, Market Trends: Worldwide, the State of Mobile Video, 2012.

Additional take-aways from this report include the following:

  • Allot Communication’s reports that mobile streaming grew 93% in the first half of 2011; Allot also reports that the usage of YouTube’s mobile channel grew by 152% and YouTube generated 22% of all mobile video traffic in the first half of 2011.  YouTube reports getting 400 million video views a month globally.
  • Gartner reports from a survey completed in the 4th quarter of 2010 that 32% of mobile enterprise users watch short videos from YouTube and other sites optimized for video streaming.
  • The fastest growth for mobile video will be in Latin America as smartphone adoption continues to accelerate, replacing traditional cell phones in these markets.  Asia/Pacific will have the highest number of mobile video users at 541 million by 2016.  Both of these markets will benefit from low-cost smartphones being produced by contract manufacturers who are becoming the dominant production strategy of brand leaders globally. The following graphic shows the Mobile Video User Forecast by Region, Worldwide, 2008 – 2016.

  • By 2016, close to 60% of professionally developed mobile video content will be delivered via mobile-optimized websites that also have enhanced contextual search functionality included in the content management systems.
  • Mobile customer care, mobile commerce and mobile health will be the three primary industry drivers in the near-term of mobile video market, emerging as growth catalysts of this emerging market.
  • Cisco’s Visual Networking Index study reports that last year, mobile video accounted for 56% of all mobile data traffic.
  • 3G/4G connections are emerging as a powerful catalyst of mobile video growth.  Gartner is forecasting that the worldwide share of mobile video connections on 3G/4G will increase from 18% in 2011 to 43% in 2015.  In more established markets incouding North America and Western Europe, the percentage of 3G/4G connections is expected to be as high as 80% and 96% respectively.
  • Gartner projects that 70% of mobile video users will use only Wi-Fi to view mobile video, with the remainder of the market relying on a mix of cellular and Wi-Fi networks to gain access and also upload content.   The following figure shows the Mobile Video User Forecast by Network Type, Worldwide, 2008 – 2016.

Source: Market Trends: Worldwide, the State of Mobile Video, 2012. Gartner Group. Published: 10 February 2012 ID:G00223693 Author: Shalini Verma.   Link: http://www.gartner.com/id=1920315

Forecasting Public Cloud Adoption in the Enterprise

The economics of public cloud computing are accelerating the pace of change occurring in enterprise software today.

Many of the scenarios that Clayton Christensen insightfully describes in The Innovator’s Dilemma are playing out right now in many sectors of this industry, shifting the balance of purchasing power to line-of-business leaders away from IT.  True to the cases shown in the book, new entrants are bringing disruptive innovations that are being successfully used to attack the most price-sensitive areas of the market.  Winning customers at the low-end and making their way up-market, new entrants are changing the customer experience, economics and structure of the industry.  Salesforce.com is a prime example of how the insights shared in The Innovator’s Dilemma are alive and well in the CRM market for example.  This is an excellent book to add to your summer reading list.

Defining The Public Cloud

The National Institute of Standards and Technology (NIST) have defined the public cloud in their latest definition of cloud computing in their September, 2011 brief you can download here (The NIST Definition of Cloud Computing). The NIST defines public cloud as “the cloud infrastructure is provisioned for open use by the general public. It may be owned, managed, and operated by a business, academic, or government organization, or some combination of them. It exists on the premises of the cloud provider.”   In addition the NIST defines three models including Software as a Service (SaaS), Platform as a Service (PaaS), and Infrastructure as a Service (IaaS).  Gartner’s definition of public cloud computing is comparable yet includes Business Process as a Service (BPaaS) and Cloud Management and Security.

A quick check of the term public cloud on Google Insights shows the rapid ascent of interest in this area.  A graphic from Google Insights is shown below:

Public Cloud Adoption in the Enterprise 

In the many conversations I’ve had with CIOs and CEOs of manufacturing companies the role of cloud computing comes up often.  There’s a very clear difference in the thinking of CIOs who see their jobs as selectively applying technologies to strategic needs versus those who are focused on compliance and risk aversion.  The former see their enterprises moving to public and hybrid clouds quickly to better integrate with dealers, distributors and suppliers at a strategic level.

The public cloud’s pervasiveness in the enterprise is growing rapidly.  This market dynamic is reflected in the report, Forecast: Public Cloud Services, Worldwide, 2010-2016, 2Q12 Update (ID:G00234814).  Gartner breaks out forecasts into the areas of Cloud Business Process Services/Business Process as a Service (BPaaS), Application Services/Software as a Service (SaaS), Application Infrastructure Services/Platform as a Service (PaaS), System Infrastructure Services/Infrastructure as a Service (IaaS) and Cloud Management and Security Services.  Highlights from the report are presented in the following five areas:

Cloud Business Process Services/Business Process as a Service (BPaaS)

  • Gartner is predicting that BPaaS will grow from $84.1B in 2012 to $144.7B in 2016, generating a global compound annual growth rate of 15%.
  • Of the eight subsegments Gartner is tracking in their BPaaS forecast, Cloud Payments (17.8%) Cloud Advertising (17.1%) and Industry Operations (15.1%) are expected to have the greatest compound annual growth rates (CAGR) in revenues generated by 2016.
  • In terms of revenue generated, Cloud Advertising is projected to grow from  $43.1B in 2011 to $95B in 2016, generating 17.1% CAGR in revenue growth through 2016.
  • Cloud Payments are forecast to grow from $4.7B in 2011  to $10.6B in 2016, generating a CAGR of 17.8% worldwide.
  • E-Commerce Enablement using BPaaS-based platforms is expected to grow from $4.7B in 2011 to $9B in 2016, generating a 13.6% CAGR in revenue globally.

Application Services/Software as a Service (SaaS)

  • SaaS-based applications are expected to grow from $11.8B in 2012 to $26.5B in 2016, generating a CAGR of 17.4% globally.  Gartner tracks ten different categories of SaaS applications in this latest forecast with CRM, ERP, and Web Conferencing, Teaming Platforms, and Social Software Suites being the three largest in terms of global revenue growth.
  • The three fastest-growing SaaS areas include Office Suites (40.7%), Digital Content Creation (32.2%) and Business Intelligence applications (27.1%) having the highest CAGRs from 2011 through 2016.
  • SaaS-based CRM will see the largest global revenue growth of all categories, increasing from $3.9B in 2011 to $7.9B in 2016, achieving a 15.1% CAGR worldwide.
  • Web Conferencing, Teaming Platforms, and Social Software Suites will grow from $2B in 2011 to $3.4B in 2016, generating an 11.2% CAGR.  Gartner is including Enterprise 2.0 applications in this category.
  • Supply Chain Management (SCM) is an area that Forrester, Gartner, IDC and others have predicted significant growth in.  Gartner’s latest forecast for SaaS-based SCM is $1.2B spent in 2011 growing to $3.3B in 2016, representing a 21.1% CAGR.

Application Infrastructure Services/Platform as a Service (PaaS)

  • Growth rates by PaaS subsegment include the following: Application Development (22%), Database Management Systems (48.5%), Business Intelligence Platform (38.9%) and Application Infrastructure and Middleware (26.5%).
  • Application Infrastructure and Middleware is expected to be the largest revenue source in PaaS for the next four years.  Gartner reports this subsegment  generated $649M in 2011, projected to grow to $2.1B in 2016, generating $1.5B in revenue and a 26.5% CAGR.

System Infrastructure Services/Infrastructure as a Service (IaaS)

  • With a projected CAGR of 41.7%, this segment is the fastest growing of the five Gartner included in their public cloud forecast.  From $4.2B in revenue generated in 2011 to $24.4B in 2016, IaaS is expected to grow by just over $20B in the forecast period globally.
  • CAGR by IaaS segment from 2001 to 2016 include Compute (43.2%), Storage (36.6%) and Print (16%).
  • The Compute subsegment is expected to see the greatest revenue growth globally, growing from $3.3B in 2011 to $20.2B in 2016, generating a 43.2% CAGR.

Cloud Management and Security Services

  • Comprised of Security, IT Operations Management and Storage Management, Cloud Management and Security Services generated $2.3B in 2011 with a forecast of $7.9B in 2016, generating a 27.2% CAGR.
  • IT Operations Management (38.2%), Storage Management (30.6%) and Security (23.7%) each have relatively high CAGRs through 2016.

Bottom line:  Of the five areas Gartner includes in their forecast, BPaaS  and its subsegments show trending towards greater support for enterprise-wide transaction and e-commerce management. With 76% of the entire 2012 public cloud forecast being in the BPaaS segment, it is clear Gartner is seeing strong interest on the part of enterprise clients to spend in this area.

Roundup of Cloud Computing Forecasts and Market Estimates, 2012

The latest round of cloud computing forecasts released by Cisco, Deloitte, IDC, Forrester, Gartner, The 451 Group and others show how rapidly cloud computing’s adoption in enterprises is happening.  The better forecasts quantify just how and where adoption is and isn’t occurring and why.

Overall, this year’s forecasts have taken into account enterprise constraints more realistically  than prior years, yielding a more reasonable set of market estimates.  There still is much hype surrounding cloud computing forecasts as can be seen from some of the huge growth rates and market size estimates.  With the direction of forecasting by vertical market and process area however, constraints are making the market estimates more realistic.

I’ve summarized the links below for your reference:

  • According to IDC, by 2015, about 24% of all new business software purchases will be of service-enabled software with SaaS delivery being 13.1% of worldwide software spending.  IDC further predicts that 14.4% of applications spending will be SaaS-based in the same time period. Source: http://www.idc.com/getdoc.jsp?containerId=232239
  • The cloud computing marketplace will reach $16.7B in revenue by 2013, according to a new report from the 451 Market Monitor, a market-sizing and forecasting service from The 451 Group. Including the large and well-established software-as-a-service (SaaS) category, cloud computing will grow from revenue of $8.7B 2010 to $16.7B in 2013, a compound annual growth rate (CAGR) of 24%. https://451research.com/
  • Deloitte is predicting cloud-based applications will replace 2.34% of enterprise IT spending in 2014 rising 14.49% in 2020.  The  slide below  is from an excellent presentation by Deloitte titled Cloud Computing Forecast Change downloadable from this link.

  • Gartner predicts Small & Medium Business (SMB) in the insurance industry will have a higher rate of cloud adoption (34%) compared to their enterprise counterparts (27%).  Gartner cites that insurance industry’s opportunity to significant improve core process areas through the use of technology.  The following figure from the report, 2011 SMB Versus Enterprise Software Budget Allocation to Annual Subscriptions indicates the differences in software budget allocation for annual subscriptions by vertical market from the report:

2011 SMB Versus Enterprise Software Budget Allocation to Annual Subscriptions

  • Gartner is predicting that the cloud system infrastructure (cloud IaaS) market to grow by 47.8% through 2015. The research firm advises outsourcers not moving in that direction that consolidation and cannibalization will occur in the 2013 – 2014 timeframe  The providers named most often by respondents were Amazon (34%), SunGard (30%) and Verizon Business (30%). Of the global top 10 IT outsourcing market leaders, only CSC appears on the list. Source: User Survey Analysis: Infrastructure as a Service, the 2011 Uptake  Claudio Da Rold,  Allie Young.

External Service Providers Being Considered for IaaS (or Cloud IaaS)

Analytics, Cloud Computing Challenge Flat Growth in Forrester’s Tech Market Outlook for 2012

It’s time to strip away the hype surrounding analytics, big data and cloud computing by asking how these technologies contribute  to excellent customer experiences and greater customer engagement.  Those are the real catalysts of market growth and the greatest disruptive forces at work in enterprise software today.

Filtering forecasts of future technology adoption with a customer experience and engagement mindset is essential for separating hype from reality.  Two excellent blog posts were published today that provide useful insights for doing this.  Ray Wang’s Monday’s Musings: 10 Mega Business Trends To Watch For In 2012 provides pragmatic, insightful analysis of the progression going on from transactional to personal fulfillment systems.  Many of the CIOs I’ve met with in the last two months are saying exactly what Ray has written regarding this transition.   Paul Greenberg’s CRM 2012 Forecast – The Era of Customer Engagement – Part I delivers more insight than any of the financial or industry analyst reports I’ve read in the last twelve months on CRM and its intersection to social networks.  He has defined customer engagement so thoroughly I am sure this post will be a classic, referenced for years to come.  Both posts provide an excellent framework to evaluate the upcoming wave of new forecasts due out from research firms at the start of 2012.

Having recently read Forrester’s US Tech Market Outlook For 2012 and applying the concepts Ray Wang and Paul Greenberg discuss, here are several take-aways from that report:

  • Total U.S. ICT market in 2011 was $962B with the majority being generated from software sales ($208B) followed by Telecom Services ($199B) and IT Consulting and Systems Integration Services ($188B).  The following graphic illustrates the purchase of ICT product and services in the U.S. during 2011.  As enterprise software companies are striving to deliver what Ray Wang is calling Experiential Systems, the majority of their core Intellectual Property (IP) was obtained from building Transactional Systems.  Despite this conflict, software development methodologies including Agile give the industry a fighting chance at growth in 2012.
  • Software continues to dominate both in total revenue ($208B) and growth rate, with 8.2% growth projected for 2012.  In addition to analytics and Business Intelligence (BI), Forrester is predicting an increase in ERP, Middleware and SaaS-based application growth.
  • Forrester is most optimistic in their forecasts for analytics, BI, Cloud Computing and Smart Computing.  Cloud Computing forecasts at Forrester are indexed to sales levels of NetSuite, RightNow Technologies (Oracle), Salesforce.com, and Ultimate Software.  Forrester is claiming these four vendors will generate a 23% increase in revenues in calendar Q1, 2012 over Q1, 2011, increasing and staying constant at 24% year-over-year growth from Q2 to Q4, 2012 relative to Q2 to Q4,  2011. Salesforce.com could accomplish this level of growth through acquisitions alone. They’re showing they can integrate newly acquired companies faster than Oracle, who they are challenging for global CRM market leadership in the 2012 – 2013 timeframe.  When customer experience and engagement is taken into account, the forecast seems high.  Salesforce knows how to translate trial users into customers.  The question is can they do this fast enough in 2012 throughout the enterprise and mid-tier accounts to keep up their sales growth on track while reducing churn and increasing profitability.
  • Smart Computing is defined by Forrester as platform technologies including specialized analytics, BI, service-oriented architecture (SOA) infrastructure, virtualization software, rules engines, and awareness-based technologies.  Forrester is very optimistic about this area with a growth rate second only to cloud computing. Its index of the market is based on Informatica, Pegasystems, and Tibco Software.  Forrester is predicting in calendar Q1, 2012 there will be 16% growth over Q1, 2011, followed by consistent 13% growth year-over-year for Q2 to Q4, 2012 relative to 2011.  The following graphic compares growth of both Cloud Computing and Smart Computing.

  • The inflexion point of Smart Computing will happen when analytics, BI and awareness-based technologies including RFID can be used to make customer experiences consistently positive and drive cultural change throughout a business to center on customers’ expectations.  Paul Greenberg refers to this area of customer engagement in his blog post.  I agree with him and see the real value of analytics not for reporting, but for being a barometer of just how customer-centric and focused on delivering exceptional customer experiences a company is becoming.
  • In 2012, financial services, professional services, and manufacturing will be the three industries that dominate software purchases.  Financial services (19%), professional services (15%) and manufacturing (14%) will be the largest buyers of enterprise software.  Forrester believes that ERP replacements, supply chain management (SCM) and product lifecycle management (PLM) will all be proprieties in the coming twelve months.

Bottom line: Critiquing high growth technologies based on their contribution to customer experience, engagement and the creation of Customer Lifetime Value (CLV) is what matter most. Hopefully the new wave of forecasts for 2012 and beyond will take the customer – not just technology and statistical extrapolations – into account.

Enterprise Software as a Service Market Forecast: The Future is Already Here – It’s Just Not Evenly Distributed

The prescient quote by William Gibson aptly describes the worldwide Software as a Service (SaaS) market today, especially in the enterprise.

Global adoption and growth of SaaS within enterprises is unevenly distributed yet growing rapidly.  One of the primary catalysts moving this forward are Amazon Web Services, Google, Microsoft, Salesforce and other platform providers lowering the barriers to creating new applications, continually investing in security technologies, and streamlining rapid prototyping, testing, and release of SaaS applications.

This week Salesforce showed how extensive the momentum is in their global base of developers during Dreamforce ’11.  The Developer Zone had the most innovation per square foot of any venue at this conference.  Insights gained from visiting the sessions at Dreamforce, speaking with Force evangelists and tech staff, and also with attendees form the basis of the following analysis and insights.  On Friday of last week Gartner also released the report, Forecast: Software as a Service, All Regions, 2010-2015 by Sharon A. Mertz, Chad Eschinger, Tom Eid, Yanna Dharmasthira, Chris Pang, Laurie F. Wurster, Tsuyoshi Ebina, Hai Hong Swinehart, which validated several of the trends seen in the Developer Zone at Dreamforce ’11.

Forecasting the Growth of SaaS in the Enterprise, 2015

In speaking with developers, vendors and after reviewing the Gartner report, here are several insights gained that illustrate how SaaS adoption will vary by region over the next four years:

  • APIs are getting more adept at managing multi-party transactions across all platforms.  Marc Benioff and Chuck Phillips alluded to this when Infor announced Inforce this week at Dreamforce.  It was also evident in how partners in the Developer Zone were demonstrating frameworks for supporting more advanced enterprise software application development.  These included supply chain management, the ability to manage complex project plans more effectively using apps based on these APIs, and greater control over collaboration development.  Gartner published their total software revenue forecast for SaaS delivery, 2007 – 2015 back in June, and a table from that analysis is shown below.  Their forecast reflects in large part depth of REST APIs which are part of Web Services.   This table is from the report, Forecast: Software as a Service, Worldwide, 2010-2015, 1H11 Update, 22 June 2011, ID:G00213816, Sharon A. Mertz, Chad Eschinger, Tom Eid, Chris Pang, Laurie F. Wurster.
  • Graphical interface flexibility, usability options, localization, and local language support dominate EMEA concerns about SaaS.  In Dreamforce sessions attended and in the Gartner report, it’s clear Salesforce is struggling to make localization work more effectively via their programming platforms and tools in EMEA.  This came out during many of the discussions in the Developer Zone as well.  All platform providers are facing this challenge, yet the pace of new API enhancements shows significant potential.  As a result the forecast for SaaS revenue in Western Europe is forecasted to be $2.66B in 2011 growing to $4.8B in 2015, achieving a compound annual growth rate (CAGR) of 17% according to Gartner.
  • Total Cost of Ownership (TCO) is aggressively pushed by Salesforce in the U.S. yet is most effective in EMEA.  This became evident in discussions and presentations, and also was validated by the recent Gartner report.  Salesforce also has extensive TCO calculators on its Force developer sites for the U.S. yet ironically they are finding they are most effective in EMEA sales cycles.
  • Based on my informal poll 20% of iPad-to-Salesforce account demos failed at Dreamforce.    Dozens of companies were hyping their iPad clients at Dreamforce, yet I found nearly one in five failed to deliver reliable performance. While the sample is hardly scientific, it does show that the iPad to Salesforce integration so heavily hyped by so many vendors is still nascent.  It’s as if these companies invested so much on iPad clients they ran out of time to make the back-end integrations work reliably.  Gartner found that lack of integration is the single greatest inhibitor to SaaS growth in North America.
  • Ease of speed and deployment, limited capital expense, and lower TCO are the most critical factors driving SaaS growth in U.S. enterprises today.  This became evident from listening to customer testimonials during the many vendor sessions in Moscone West, in addition to discussions with developers.  The impact of these factors is also evident in the total software revenue forecast for SaaS delivery within enterprise application software markets by region, 2008 – 2015.   This is from the Gartner report, Forecast: Software as a Service, All Regions, 2010-2015. Sharon A. Mertz, Chad Eschinger, Tom Eid, Yanna Dharmasthira, Chris Pang, Laurie F. Wurster, Tsuyoshi Ebina, Hai Hong Swinehart.

  • CRM continues to dominate SaaS usage across all enterprise applications, closely followed by Web conferencing and e-learning in North America and Northern Europe.  Both North America and Northern Europe have comparable adoption trends regarding these SaaS applications, with Western and Southern Europe lagging in terms of adoption and spending.
  • Asia/Pacific continues to be the most fragmented of all regions when it comes to SaaS adoption in the enterprise.  Countries with greater stability of their Internet infrastructures including Australia, Hong Kong, Singapore and South Korea are experiencing greater SaaS growth, and also contributing to Salesforce’s success in these regions.  Salesforce has 14.5% CRM share in this region, third behind SAP and Oracle. Emerging countries are the most rapid adopters of SaaS-based accounting, e-mail and collaboration-based apps.
  • China, India and Malaysia are experiencing the most rapid adoption of SaaS-based enterprise applications in the Asia/Pacific region.  WiPro’s decision to invest so heavily in Dreamforce as a promotional event is a case in point.  The Developer Zone had  several companies from this region offering their programming and system integration services as well.

Bottom line: SaaS adoption continues to accelerate globally across enterprise software, growing from $12B in 2011 to $21B in 2015, achieving a 16.3% CAGR annually. Platform providers are knocking down the barriers to market growth by using events including Dreamforce to educate, entertain and enable developers to quickly turn concepts into applications.

SaaS-based Analytics and Business Intelligence Market Update, August 2011

Challenging, uncertain economic times accelerate sales cycles and lead to more closed deals for business intelligence software providers.  Companies get an urgency to reduce costs and risks, relying on the insights gained from these applications.

There’s an interesting dichotomy starting to emerge in how experts and analysts define just how these markets will mature however.  Both agree that economic uncertainty are growth catalysts yet they diverge on adoption rates, roadblocks, and which analytics and BI technology will dominate in the years ahead.

This week I read Balancing Custom And Packaged Apps In Your Application Portfolio Strategy by George Lawrie, Mike Gilpin and Adam Knoll from Forrester and the latest Hype Cycle of Business Intelligence, 2011 by a collection of Gartner authors led by Andreas Bitterer.  I’ve summarized the key points of each below.

Forrester Sees SaaS Applications Overtaking Custom Application Development

Forrester sees SaaS-based applications starting to replace in-house custom application development, gathering momentum through 2013.  Gartner, with their Hype Cycle for Business Intelligence, 2011 just released this week, shows BI platforms having greater near-term benefit than SaaS-based analytics and BI.  Custom application development projects are going to face continued pressure to keep up with business requirements that SaaS applications are proving able to handle more effectively and economically than ever before.

In-house development makes more sense for specific analytics and reporting requirements,  yet will continually be eroded by SaaS-based applications that can meet most requirements at a lower cost.  Forrester has in the past said SaaS-based adoption of analytics applications in general and predictive applications specifically would be very slow due to data integration challenges.  This study points to a potential shift in their mindset, as the data shows SaaS-based analytics beginning to replace custom in-house developed applications.

Here are the key take-aways from the report:

  • Analytics processes are supported 79% of the time with custom application development.  Procure-to-pay (33%) and record-to-report (33%) are the second-most supported.  Multiple responses were allowed in the survey.
  • When asked which process areas they are automating with SaaS, analytics (33%), record-to-report (18%), order-to-cash  (15%), and purchase-to-pay (12%) were the most common responses.  There was a small sample size on the Forrester report and the most startling insight was how quickly respondent companies plan to migrate from custom application development to SaaS-based analytics and BI.
  • Nearly 50% of the respondents to the Forrester survey have between five and 19 SaaS-based applications today with 18% expecting to have 35 or more by 2013.  In addition 63% of respondents expect to deploy between five and 34 SaaS-based applications by 2013, a significant shift in just two years.
  • 36% of survey respondents say their  SaaS applications run completely standalone.  Another 36% mention they use a combination of on-premises Master Data Management (MDM) and process integration tools.  Ironically only 3% are deploying their applications on cloud-based MDM or process integration-based platforms.

Gartner’s Hype Cycle for Business Intelligence, 2011

Unlike the hype cycle for cloud computing, this hype cycle has fewer technology categories (25), a narrative firmly grounded in business process and strategy, and more practical and pragmatic insights versus just theoretical.  At 50 pages it’s  quick read and while there are many excellent points made, I have summarized the key take-aways pertaining to the highest hype points and SaaS adoption below:

  • Mobile Business Intelligence (BI) is the latest entry to the Hype Cycle for Business Intelligence based on the massive hype around analyzing locational and application data.  The hype surrounding the Apple iPad Series, Google Android and other tablet and smartphone platforms has made this one of the most hyped areas of the last year according to the analysis.
  • Consumerization, Decision Support, analysis of non-traditional data and “Big Data” are the areas of the greatest innovation today.  The hype cycle points to search, mobile, visualization and data discovery being the catalyst of Consumerization.  Predictive analytics, which is on the Slope of Enlightenment on this latest hype cycle, is critical to decision support.  The non-traditional and “Big Data” area of innovation is further supported by content, text analytics, in-memory DBMSs and columnar DBMSs.
  • SaaS-based Business Intelligence is at the apex of the Peak of Inflated Expectations yet will continue to have low adoption rates.  Gartner believes that the  lack of trust in third parties managing confidential data, and the inertia and fear many companies have in moving to a new architecture are slowing adoption.  This is in contrast to the survey Forrester released this week showing analytics being one of the most popular SaaS-based applications planned by 2013 in their base of respondents.
  • Gartner sees SaaS-based Business Intelligence of the most value to midsize and smaller organizations who lack IT staff yet have very specific, targeted information needs.  Website analytics, social media monitoring, dashboards, predictive analytics and Excel as a BI front-end all apply.  Both Forrester and Gartner agree on this point and see this type of custom development going away quickly internally.
  • There is a massive amount of hype surrounding in-memory computing, particularly from SAP at its Sapphire conferences .  Gartner believes that SAP’s vision of in-memory computing exceeds  in-memory analytics to include analytical and transactional processing.  As a result, In-Memory Database Management Systems are at the Peak of Inflated Expectations.


Source: Hype Cycle for Business Intelligence, 2011, Published 12 August 2011 | ID:G00216086 By Andreas Bitterer.  Gartner, Inc.

What Both Agree On

Forrester’s survey shows SaaS eventually replacing custom application development while Gartner’s Hype Cycle for Business Intelligence shows the practical, pragmatic technologies including dashboards, predictive analytics combined with the more complex Business Activity Monitoring (BAM), Business Intelligence Platforms, and Data-Mining Workbenches delivering the most value.  Despite these differences, both agree on the following:

  • The overall market for BI, Analytics and Performance Management continues to grow at between 8 to 12% per year depending on the forecast used.  The following forecast is from the report  Market Trends: Business Intelligence, Worldwide, 2011-2014, 7 June 2011 | ID:G00213483 by Dan Sommer and James Richardson.
Source: Market Trends: Business Intelligence, Worldwide, 2011-2014, 7 June 2011 | ID:G00213483 by Dan Sommer and James Richardson
  • 2011 continues to see large, strategic deals for analytics and BI closing more rapidly than they have in the past.
  • SaaS-based analytics and BI continues to gain a greater share of spending in midsize and smaller companies.  Both also agree that the proliferation of smaller SaaS-based analytics and Bi vendors concentrating on a specific niche have successfully displaced in-house custom development of competitive applications.  Trust in the smaller vendor, their track record, customer references and financial viability are what are winning deals for SaaS-based analytics and BI software providers today.
  • The market transition from build to buy is now in full force as budgets become available again.  This is key assumption of both analyses and means that smaller, more niche-oriented SaaS-based analytics and BI vendors stand a chance to get new reference accounts and grow, despite a challenging economy.